

Question: Following are two weekly forecasts made by two different methods for the number of gallons of gasoline, in thousands, demanded at a local gasoline station.
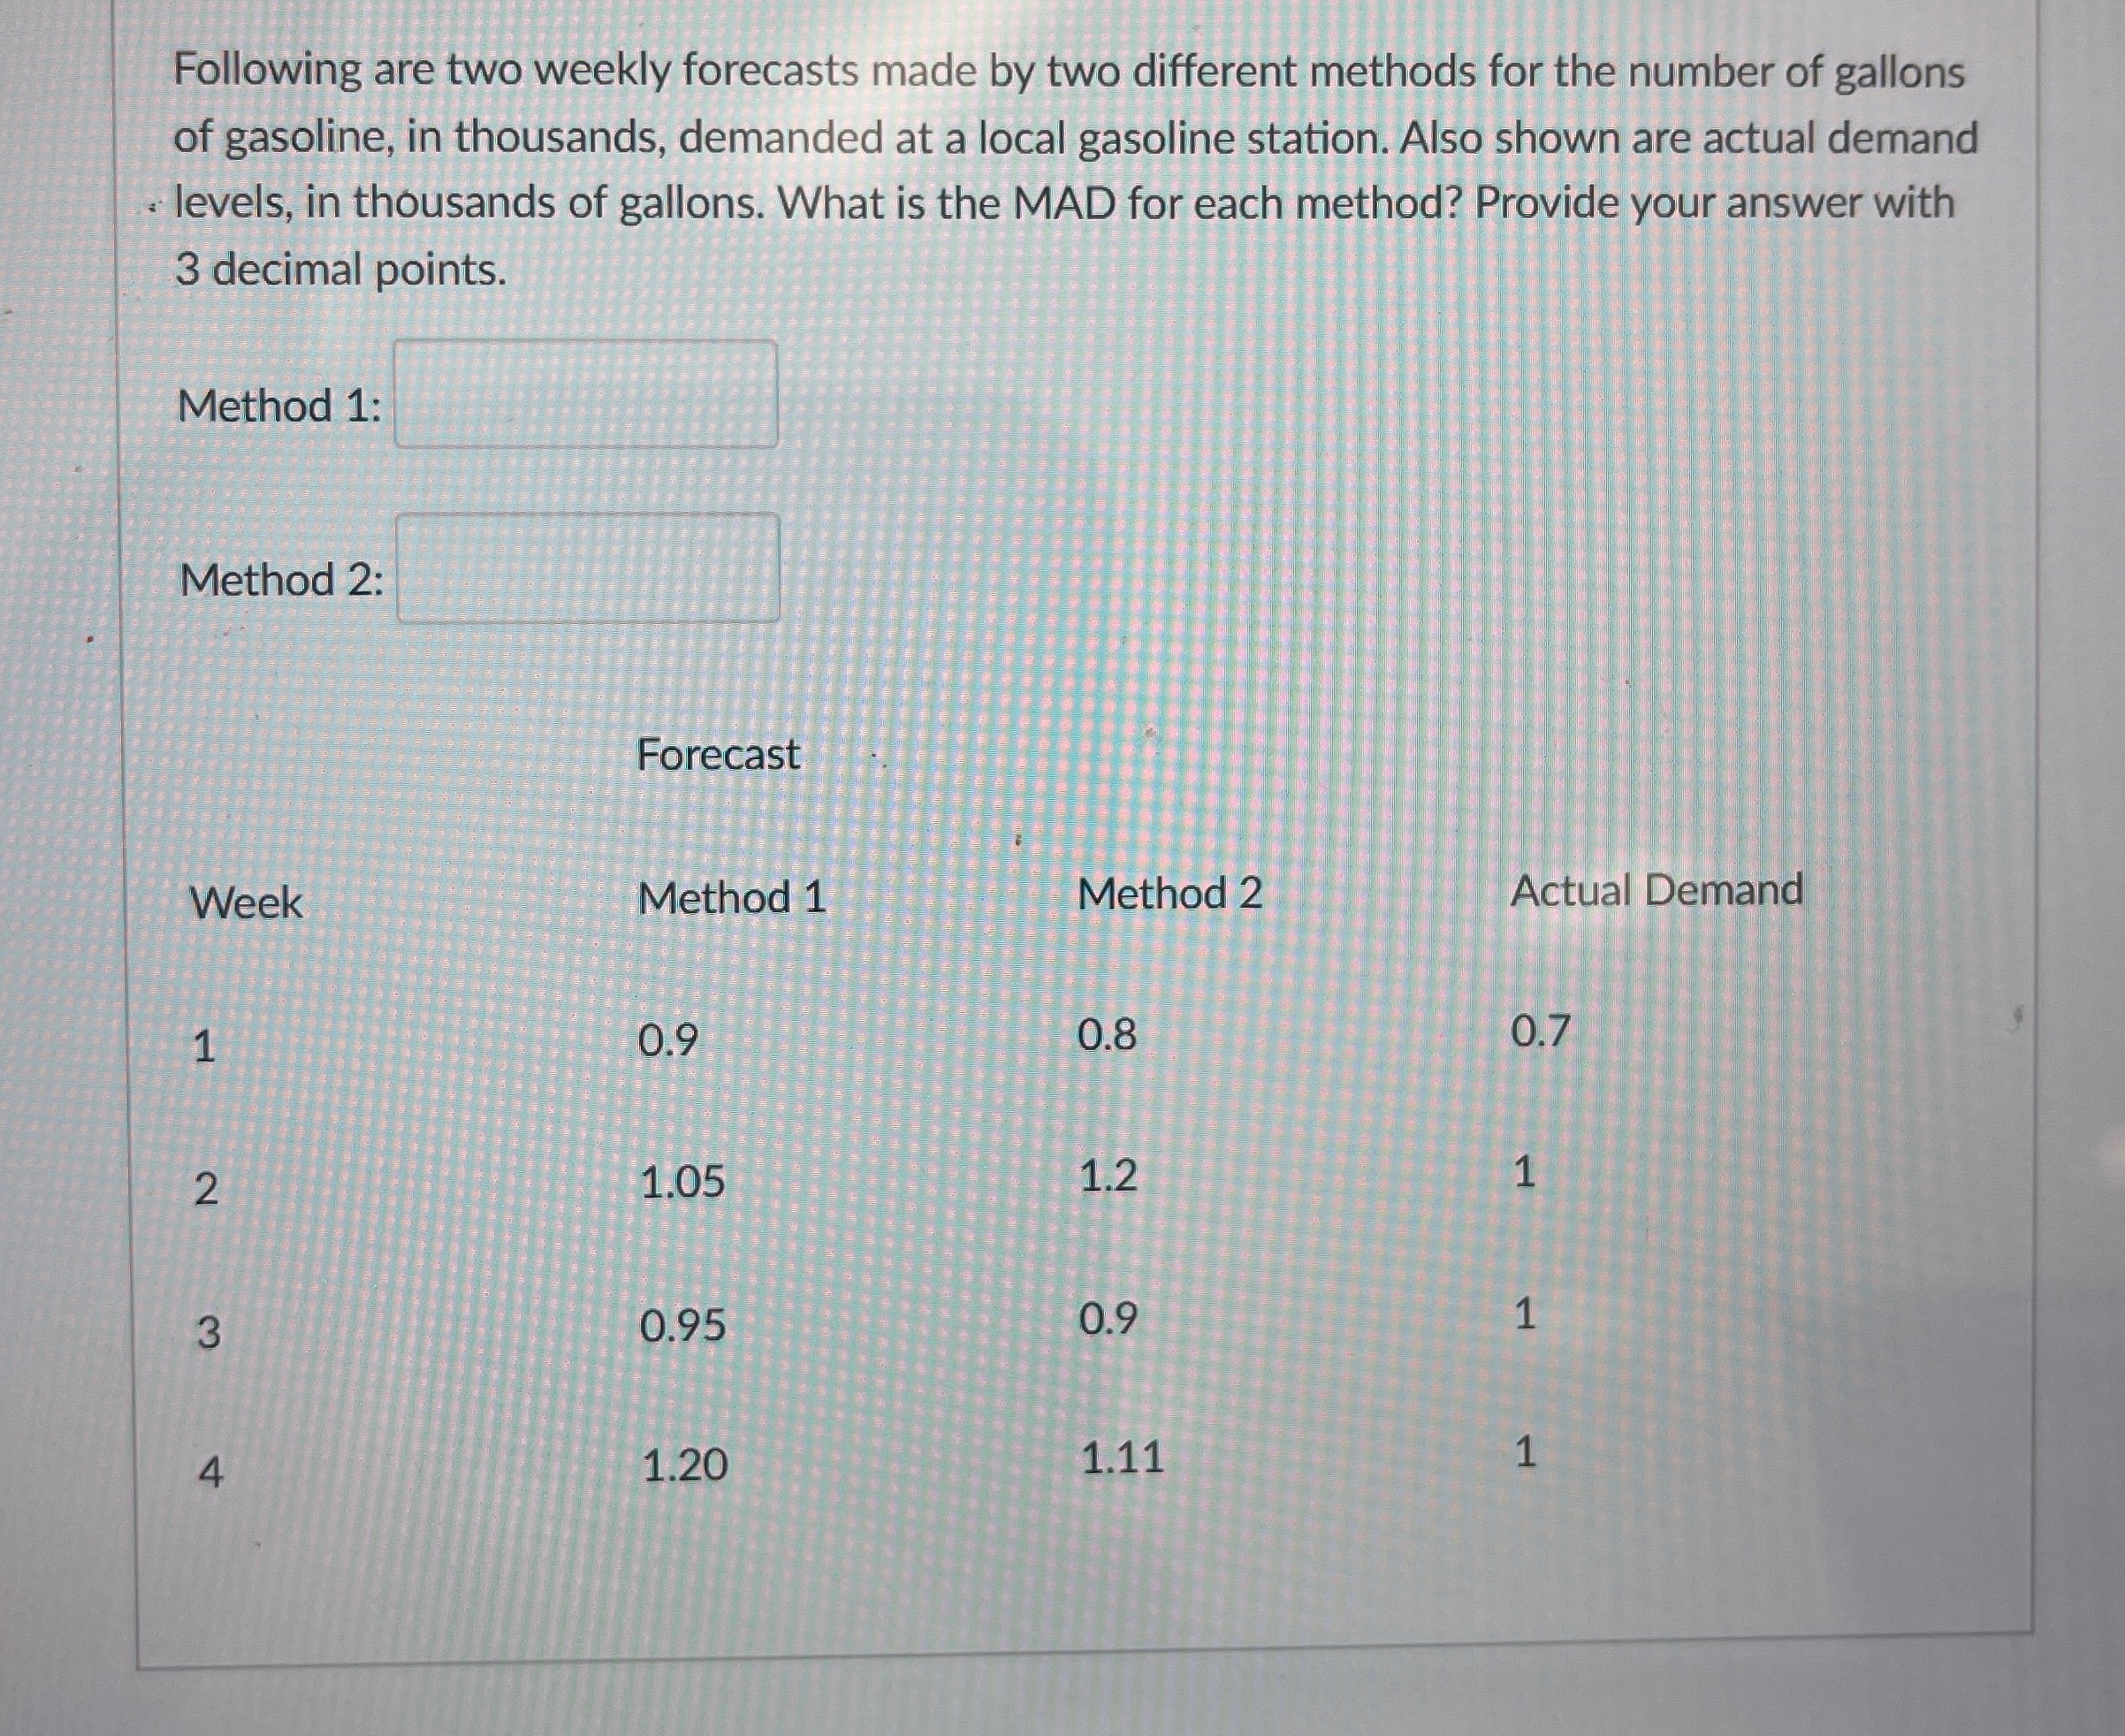
Following are two weekly forecasts made by two different methods for the number of gallons of gasoline, in thousands, demanded at a local gasoline station. Also shown are actual demand levels, in thousands of gallons. What is the MAD for each method? Provide your answer with decimal points.
Method :
Method :
Forecast
tableWeekMethod Method Actual Demand
Step by Step Solution
There are 3 Steps involved in it
1 Expert Approved Answer
Step: 1 Unlock

Question Has Been Solved by an Expert!
Get step-by-step solutions from verified subject matter experts
Step: 2 Unlock
Step: 3 Unlock