

Question: Following are two weekly forecasts made by two different methods for the number of gallons of gasoline, in thousands, demanded at a local gasoline station.
Following are two weekly forecasts made by two different methods for the number of gallons of gasoline, in thousands, demanded at a local gasoline station. Also shown are actual demand levels, in thousands of gallons:
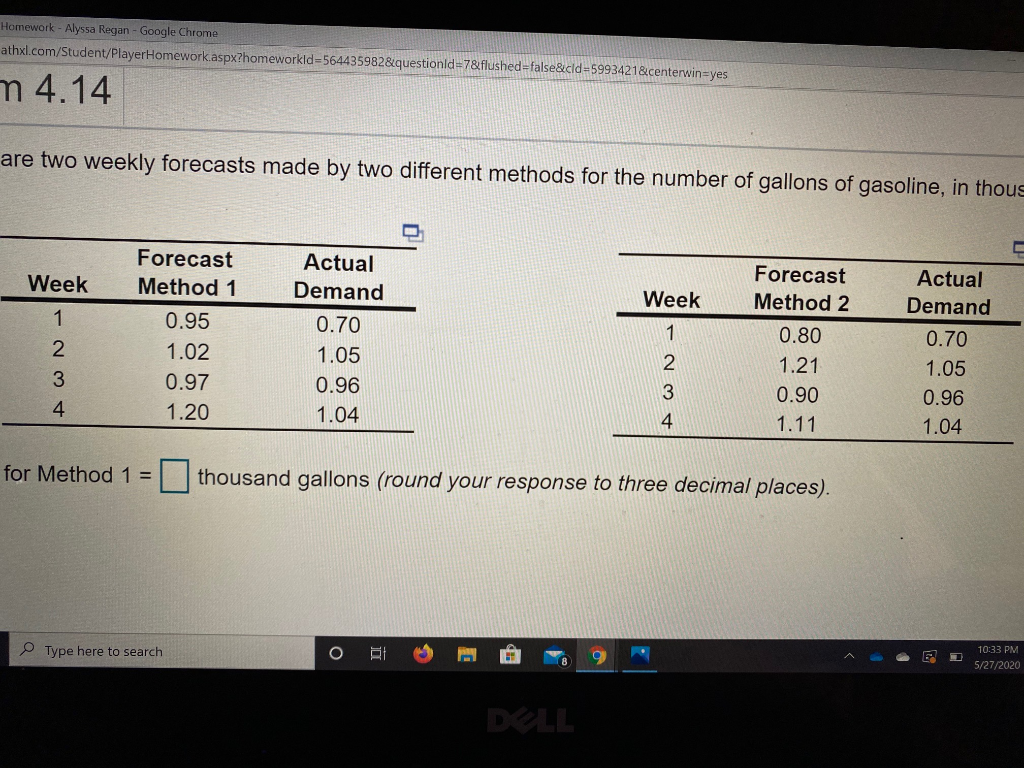
1) The MAD for Method 1 = ----- thousand gallons (round your response to three decimal places).
2) The mean squared error (MSE) for Method 1 is ------thousand gallons right parenthesis squared(thousand gallons)2
3) The MAD for Method 2 is---- thousand gallons (round your response to three decimal places).
4) The mean squared error (MSE) for Method 2 is------thousand gallons right parenthesis squared(thousand gallons)2
(round your response to three decimal places).
Homework - Alyssa Regan - Google Chrome athxl.com/Student/PlayerHomework.aspx?homeworkld=564435982&questionid=7&flushed=false&cid=5993421¢erwin=yes n 4.14 are two weekly forecasts made by two different methods for the number of gallons of gasoline, in thous Week Week 1 Forecast Method 1 0.95 1.02 0.97 1.20 Actual Demand 0.70 1.05 0.96 1.04 2 Forecast Method 2 0.80 1.21 0.90 1.11 1 2 3 4 Actual Demand 0.70 1.05 0.96 1.04 3 4 for Method 1 = thousand gallons (round your response to three decimal places). Type here to search O E 9 10:33 PM 5/27/2020 DLLStep by Step Solution
There are 3 Steps involved in it

Get step-by-step solutions from verified subject matter experts