

Question: Following are two weekly forecasts made by two different methods for the number of gallons of gasoline, in thousands, demanded at a local gasoline station.
Following are two weekly forecasts made by two different methods for the number of gallons of gasoline, in thousands, demanded at a local gasoline station. Also shown are actual demand levels, in thousands of gallons:
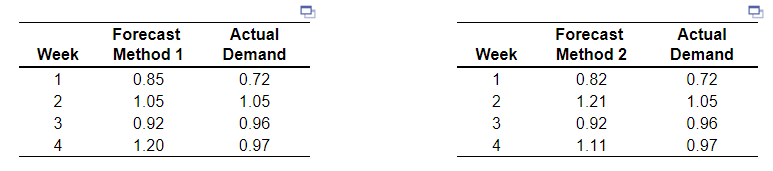
The MAD for Method 1 = ? thousand gallons (round your response to three decimal places).
The mean squared error (MSE) for Method 1 = ? thousand gallons2 (round your response to three decimal places).
The MAD for Method 2 = ? thousand gallons (round your response to three decimal places).
The mean squared error (MSE) for Method 2 = ? thousand gallons2 (round your response to three decimal places).
Week 1 2 3 4 Forecast Method 1 0.85 1.05 0.92 1.20 Actual Demand 0.72 1.05 0.96 0.97 Week 1 2 3 4 Forecast Method 2 0.82 1.21 0.92 1.11 Actual Demand 0.72 1.05 0.96 0.97Step by Step Solution
There are 3 Steps involved in it
1 Expert Approved Answer
Step: 1 Unlock

Question Has Been Solved by an Expert!
Get step-by-step solutions from verified subject matter experts
Step: 2 Unlock
Step: 3 Unlock