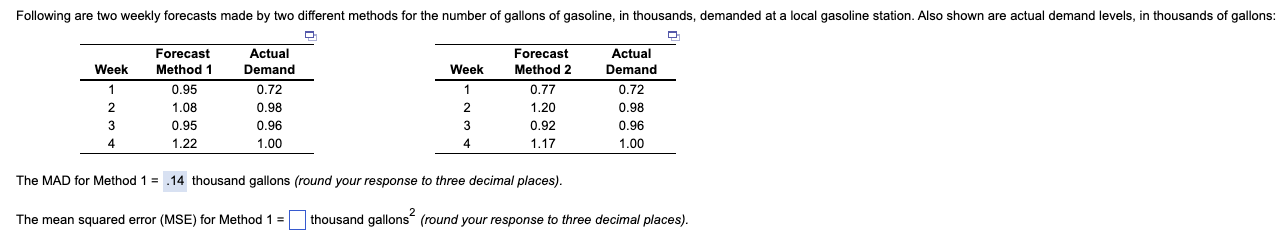
Question: Following are two weekly forecasts made by two different methods for the number of gallons of gasoline, in thousands, demanded at a local gasoline station.

Following are two weekly forecasts made by twoFollowing are two weekly forecasts made by two

Following are two weekly forecasts made by two different methods for the number of gallons of gasoline, in thousands, demanded at a local gasoline station. Also shown are actual demand levels, in thousands of gallons: Week 1 2 Forecast Method 1 0.95 1.08 0.95 1.22 Actual Demand 0.72 0.98 0.96 1.00 Week 1 2 3 4 Forecast Method 2 0.77 1.20 0.92 1.17 Actual Demand 0.72 0.98 0.96 1.00 3 4 The MAD for Method 1 = .14 thousand gallons (round your response to three decimal places). The mean squared error (MSE) for Method 1 = thousand gallons? (round your response to three decimal places). Homework: Ch.4-FC Question 11, Problem 4.16 Part 1 of 3 Sales of Volkswagen's popular Beetle have grown steadily at auto dealerships in Nevada during the past 5 years (see table below). Year 1 2 3 Sales 450 510 516 575 595 4 5 a) Forecasted sales for year 6 using the trend projection (linear regression) method are sales (round your response to one decimal place)

Step by Step Solution

There are 3 Steps involved in it

1 Expert Approved Answer
Step: 1 Unlock blur-text-image
Question Has Been Solved by an Expert!

Get step-by-step solutions from verified subject matter experts

Step: 2 Unlock
Step: 3 Unlock

Students Have Also Explored These Related General Management Questions!