

Question: Following are two weekly forecasts made by two different methods for the number of gallons of gasoline; in thousands, demanded at a local gasoline
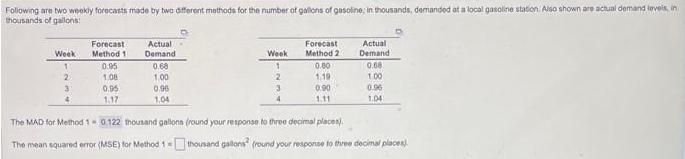
Following are two weekly forecasts made by two different methods for the number of gallons of gasoline; in thousands, demanded at a local gasoline station. Also shown are actual demand levels, in thousands of gallons Week 1 2 3 4 Forecast Method 1 0.95 1.08 0.95 1.17 Actual Demand 0.68 1.00 0.96 1.04 Week 1 2 3 Forecast Method 2 0.80 1.19 0.90 1.11 Actual Demand 0.68 1.00 0.96 1.04 The MAD for Method 10.122 thousand gallons (round your response to three decimal places) The mean squared error (MSE) for Method 1-thousand gallons (round your response to three decimal places)
Step by Step Solution
3.41 Rating (138 Votes )
There are 3 Steps involved in it
To calculate the Mean Absolute Deviation MAD for Method 1 we can use the f... View full answer

Get step-by-step solutions from verified subject matter experts