

Question: For a large retailer, the plot below gives the sales for the first quarter of 1998 through the last quarter of 2002 in millions of
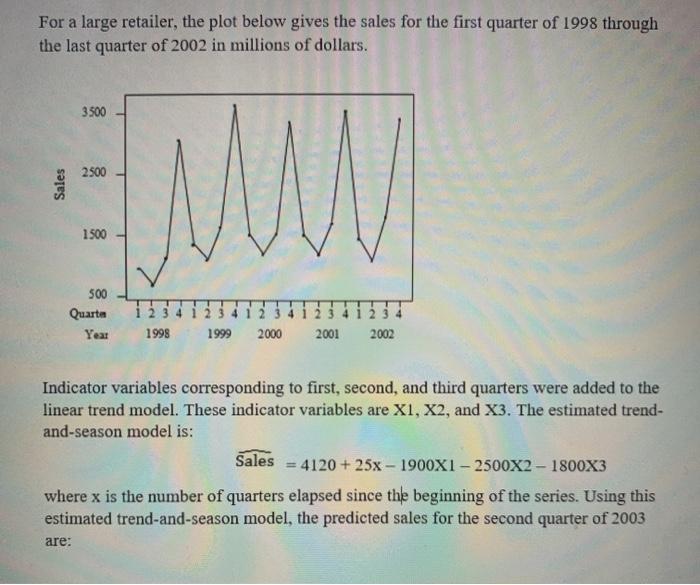
For a large retailer, the plot below gives the sales for the first quarter of 1998 through the last quarter of 2002 in millions of dollars. 3500 2500 Sales JUNIO 1500 500 Quarta Year i 2 3 4 1998 2 2000 1999 2001 2002 Indicator variables corresponding to first, second, and third quarters were added to the linear trend model. These indicator variables are X1, X2, and X3. The estimated trend- and-season model is: Sales 4120 + 25x - 1900X1 - 2500X2 - 1800X3 where x is the number of quarters elapsed since the beginning of the series. Using this estimated trend-and-season model, the predicted sales for the second quarter of 2003 are
Step by Step Solution
There are 3 Steps involved in it

Get step-by-step solutions from verified subject matter experts