

Question: For a large retailer, the plot below gives quarterly sales for the first quarter of 1998 through the last quarter of 2002 in millions of
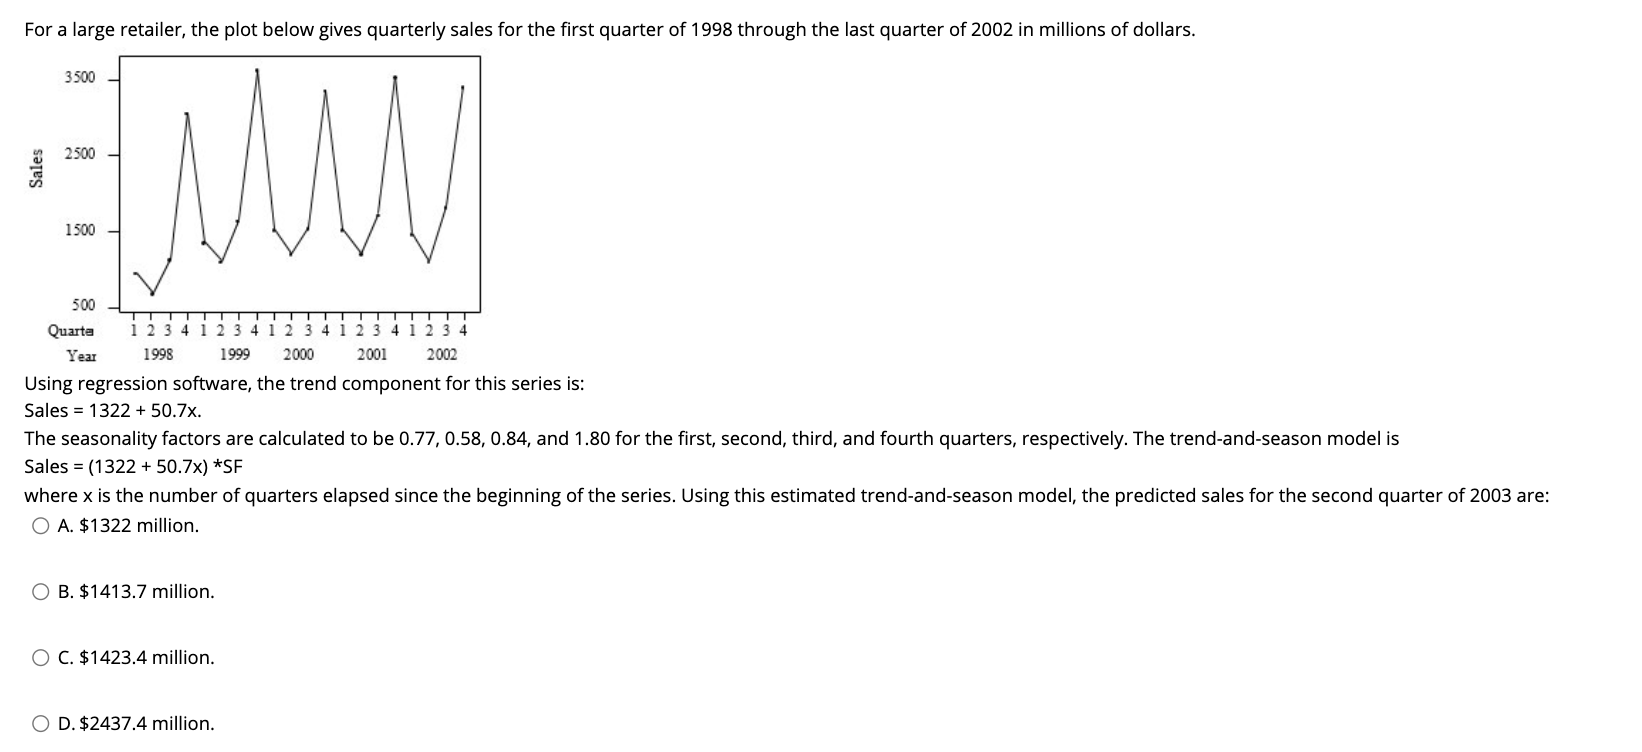
For a large retailer, the plot below gives quarterly sales for the first quarter of 1998 through the last quarter of 2002 in millions of dollars. 3500 2500 Sales 1500 3 4 500 Quarta 1 2 3 4 1 2 3 4 1 2 3 4 1 2 3 4 1 Year 1998 1999 2000 2001 2002 Using regression software, the trend component for this series is: Sales = 1322 +50.7x. The seasonality factors are calculated to be 0.77,0.58, 0.84, and 1.80 for the first, second, third, and fourth quarters, respectively. The trend-and-season model is Sales = (1322 + 50.7x) *SF where x is the number of quarters elapsed since the beginning of the series. Using this estimated trend-and-season model, the predicted sales for the second quarter of 2003 are: O A. $1322 million. O B. $1413.7 million. O C. $1423.4 million. O D. $2437.4 million
Step by Step Solution
There are 3 Steps involved in it

Get step-by-step solutions from verified subject matter experts