

Question: For a large retailer, the plot below gives the sales for the first quarter of 1998 through the last quarter of 2002 in millions of
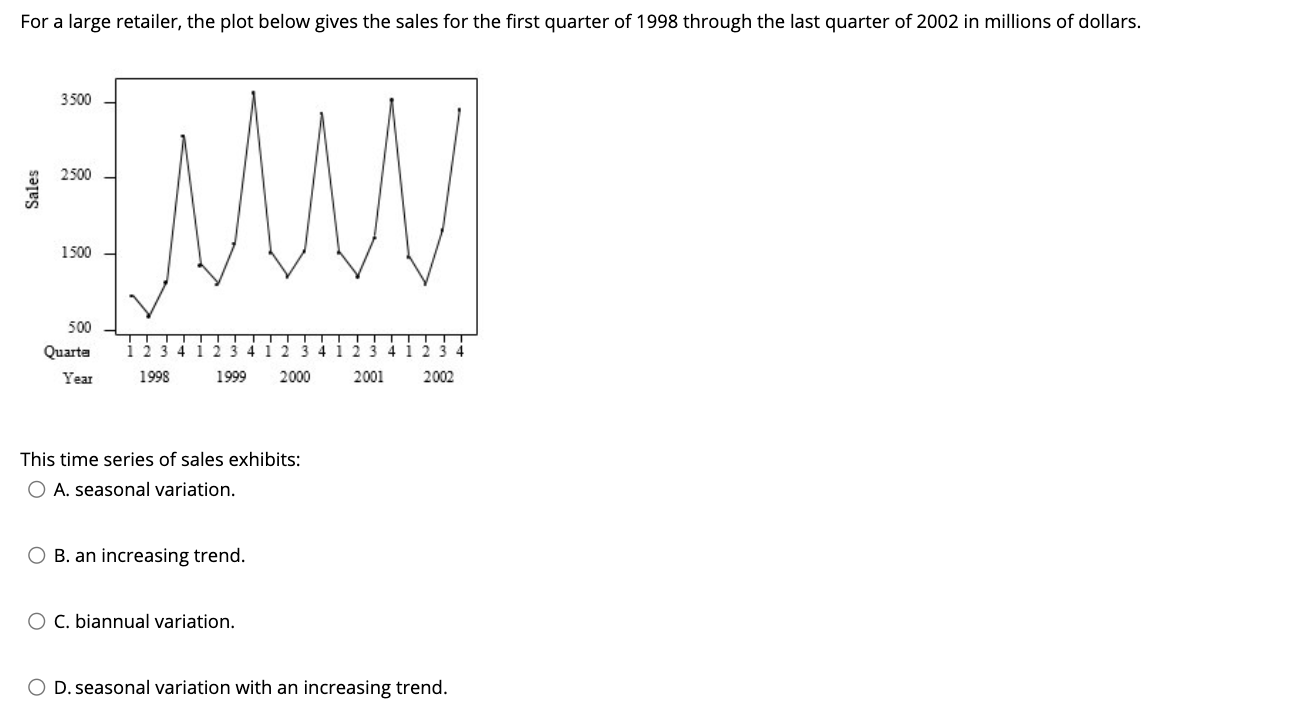
For a large retailer, the plot below gives the sales for the first quarter of 1998 through the last quarter of 2002 in millions of dollars. 3500 2500 Sales MM 1500 500 Quarta Year 1998 1999 2000 2001 2002 This time series of sales exhibits: O A. seasonal variation. O B. an increasing trend. O C. biannual variation. O D. seasonal variation with an increasing trend
Step by Step Solution
There are 3 Steps involved in it
1 Expert Approved Answer
Step: 1 Unlock

Question Has Been Solved by an Expert!
Get step-by-step solutions from verified subject matter experts
Step: 2 Unlock
Step: 3 Unlock