

Question: For A: Need UCL & LCL (3-sigma x chart) For B: Need UCL & LCL (R chart) POT Points: 0 O3 Refer to Table 56.1
For A:
POT Points: 0 O3 Refer to Table 56.1 - Factors for Computing Control Chart Limits (3 sioma) for this problem Sampling 4 pieces of precision-cut wire (to be used in computer assembly) every hour for the past 24 hours has produced the following results: x R X Hour 1 2 3 4 5 6 4.51 2.89 R 0.71" 1.18 1.48 1.31 1.22 0.37 3.15 3.10 3.32 3.29 3.17 286 Hour 7 8 9 10 11 12 x 2.96 2.55 3.02 2,96 Hour 13 14 15 16 17 18 0.53' 1.18 0.66 1.38 1.17 0.40 x R 3.11" 0.00 2.93 1.31 3.02 1.11 2.84 0.45 2.96 1.48 2.74 1.20 265 Hour 19 20 21 22 23 24 R 1.56" 1.14 1.03 0.41 1.53 1.02 2.73 3.18 2.94 2.74 3.07 Based on the sampling done, the controllimits for 3-sigma x chart are (round all intermediate calculations to three decimal places before proceeding with further calciations) Upper Control Limit (UCL)- inches (round your response to three decimal places) Need UCL & LCL (3-sigma x chart)
For B:
Need UCL & LCL (R chart) 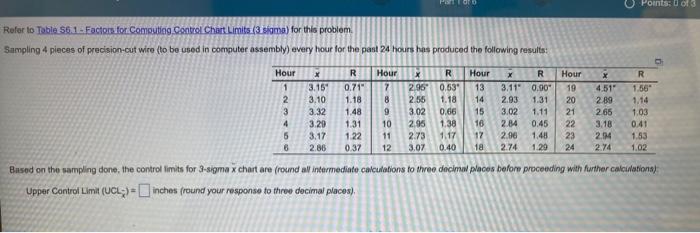
Step by Step Solution
There are 3 Steps involved in it
1 Expert Approved Answer
Step: 1 Unlock

Question Has Been Solved by an Expert!
Get step-by-step solutions from verified subject matter experts
Step: 2 Unlock
Step: 3 Unlock