

Question: For CFA Problems 8 through 9: Refer to the following table, which shows risk and return measures for two portfolios. Average Annual Rate of Return
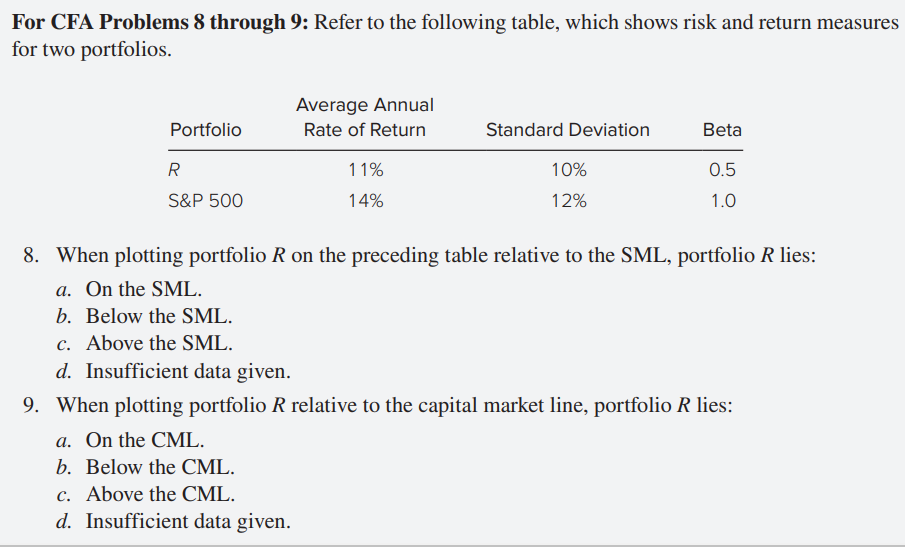
For CFA Problems 8 through 9: Refer to the following table, which shows risk and return measures for two portfolios. Average Annual Rate of Return Portfolio Standard Deviation Beta 0.5 R S&P 500 11% 14% 10% 12% 1.0 8. When plotting portfolio R on the preceding table relative to the SML, portfolio R lies: a. On the SML. b. Below the SML. c. Above the SML. d. Insufficient data given. 9. When plotting portfolio R relative to the capital market line, portfolio R lies: a. On the CML. b. Below the CML. c. Above the CML. d. Insufficient data given. For CFA Problems 8 through 9: Refer to the following table, which shows risk and return measures for two portfolios. Average Annual Rate of Return Portfolio Standard Deviation Beta 0.5 R S&P 500 11% 14% 10% 12% 1.0 8. When plotting portfolio R on the preceding table relative to the SML, portfolio R lies: a. On the SML. b. Below the SML. c. Above the SML. d. Insufficient data given. 9. When plotting portfolio R relative to the capital market line, portfolio R lies: a. On the CML. b. Below the CML. c. Above the CML. d. Insufficient data given
Step by Step Solution
There are 3 Steps involved in it

Get step-by-step solutions from verified subject matter experts