

Question: II. Use the following table which shows risk and return measures for two portfolios: Portfolio R S&P 500 Aver Annual rate of return 12. 0%
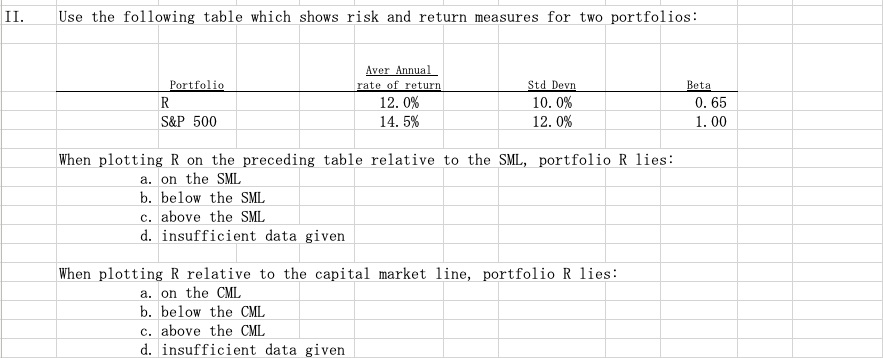
II. Use the following table which shows risk and return measures for two portfolios: Portfolio R S&P 500 Aver Annual rate of return 12. 0% 14.5% Std Devn 10. 0% 12. 0% Beta 0.65 1. 00 When plotting R on the preceding table relative to the SML, portfolio R lies: a. on the SML b. below the SML c. above the SML d. insufficient data given When plotting R relative to the capital market line, portfolio R lies: a. on the CML b. below the CML c. above the CML d. insufficient data given
Step by Step Solution
There are 3 Steps involved in it
1 Expert Approved Answer
Step: 1 Unlock

Question Has Been Solved by an Expert!
Get step-by-step solutions from verified subject matter experts
Step: 2 Unlock
Step: 3 Unlock