

Question: for EACH table answer: a) i) which chart are you going to use? (e.g. c chart, r chart, p chart, x chart) ii) Give reasons
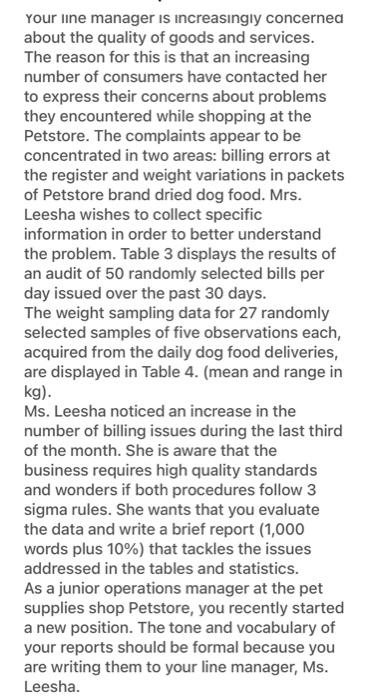
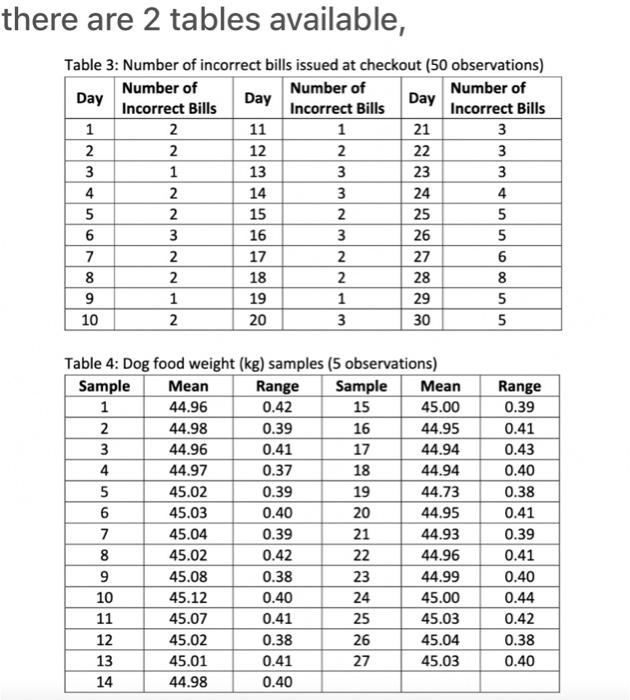
Your une manager is increasingy concerned about the quality of goods and services. The reason for this is that an increasing number of consumers have contacted her to express their concerns about problems they encountered while shopping at the Petstore. The complaints appear to be concentrated in two areas: billing errors at the register and weight variations in packets of Petstore brand dried dog food. Mrs. Leesha wishes to collect specific information in order to better understand the problem. Table 3 displays the results of an audit of 50 randomly selected bills per day issued over the past 30 days. The weight sampling data for 27 randomly selected samples of five observations each, acquired from the daily dog food deliveries, are displayed in Table 4. (mean and range in kg). Ms. Leesha noticed an increase in the number of billing issues during the last third of the month. She is aware that the business requires high quality standards and wonders if both procedures follow 3 sigma rules. She wants that you evaluate the data and write a brief report (1,000 words plus 10% ) that tackles the issues addressed in the tables and statistics. As a junior operations manager at the pet supplies shop Petstore, you recently started a new position. The tone and vocabulary of your reports should be formal because you are writing them to your line manager, Ms. Leesha. there are 2 tables available, Table 3: Number of incorrect bills issued at checkout ( 50 observations Table 4: Dog food weight (kg) samoles (5 observations)
Step by Step Solution
There are 3 Steps involved in it

Get step-by-step solutions from verified subject matter experts