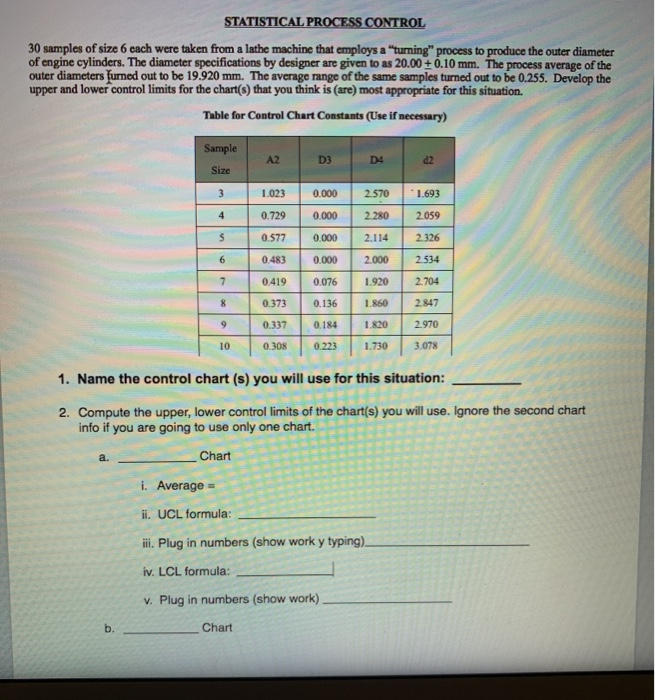
Question: STATISTICAL PROCESS CONTROL 30 samples of size 6 each were taken from a lathe machine that employs a turning process to produce the outer diameter

STATISTICAL PROCESS CONTROL 30 samples of size 6
STATISTICAL PROCESS CONTROL 30 samples of size 6 each were taken from a lathe machine that employs a "turning process to produce the outer diameter of engine cylinders. The diameter specifications by designer are given to as 20.00 +0.10 mm. The process average of the outer diameters furned out to be 19.920 mm. The average range of the same samples turned out to be 0.255. Develop the upper and lower control limits for the chart(s) that you think is (are) most appropriate for this situation. Table for Control Chart Constants (Use if necessary) Sample A2D3 D4 2 Size 2.570 1.693 2.280 2059 2.114 2326 2.000 1.023 0.000 0.729 | 0.000 0.577 0.000 0.4830.000 0.419 0.076 0.373 0.136 0.337 0.184 0.308 0.223 1.920 1.850 2.534 2.704 2.847 2 970 3.078 1.820 1.730 10 1. Name the control chart (s) you will use for this situation: 2. Compute the upper, lower control limits of the chart(s) you will use. Ignore the second chart info if you are going to use only one chart. _Chart i. Average = ii. UCL formula: iii. Plug in numbers (show work y typing) iv. LCL formula: v. Plug in numbers (show work) Chart i. Average ii. UCL formula: iii. Plug in numbers (show work y typing) iv. LCL formula: v. Plug in numbers (show work)

Step by Step Solution

There are 3 Steps involved in it

1 Expert Approved Answer
Step: 1 Unlock blur-text-image
Question Has Been Solved by an Expert!

Get step-by-step solutions from verified subject matter experts

Step: 2 Unlock
Step: 3 Unlock

Students Have Also Explored These Related General Management Questions!