

Question: For i = 1 to 1000 generate 100 random numbers between -0.5 and 0.5 (using rand 0.5) add them up . Store this sum in
For i = 1 to 1000 generate 100 random numbers between -0.5 and 0.5 (using rand 0.5) add them up . Store this sum in a vector elements x(i) 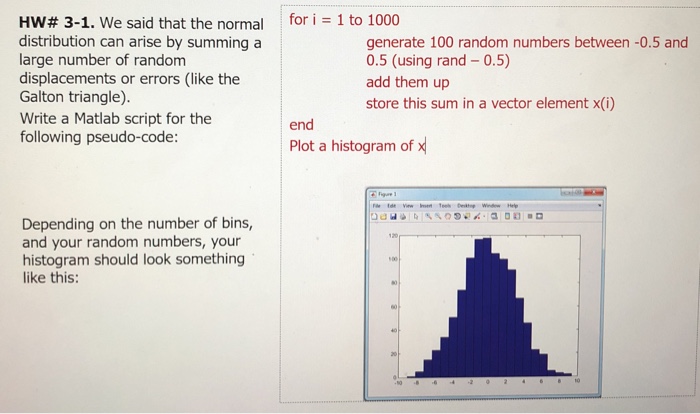
end
Plot a histogram of x
for i = 1 to 1000 HW# 3-1. We said that the normal distribution can arise by summing a large number of random displacements or errors (like the Galton triangle). Write a Matlab script for the following pseudo-code: generate 100 random numbers between -0.5 and 0.5 (using rand 0.5) add them up store this sum in a vector element x(i) end Plot a histogram of Depending on the number of bins, and your random numbers, your histogram should look something ike this
Step by Step Solution
There are 3 Steps involved in it
1 Expert Approved Answer
Step: 1 Unlock

Question Has Been Solved by an Expert!
Get step-by-step solutions from verified subject matter experts
Step: 2 Unlock
Step: 3 Unlock