

Question: For problems 1-6 use the table data illustrating starting salaries (in thousands) and math SAT scores. Treat the SAT scores as the independent variable. SAT

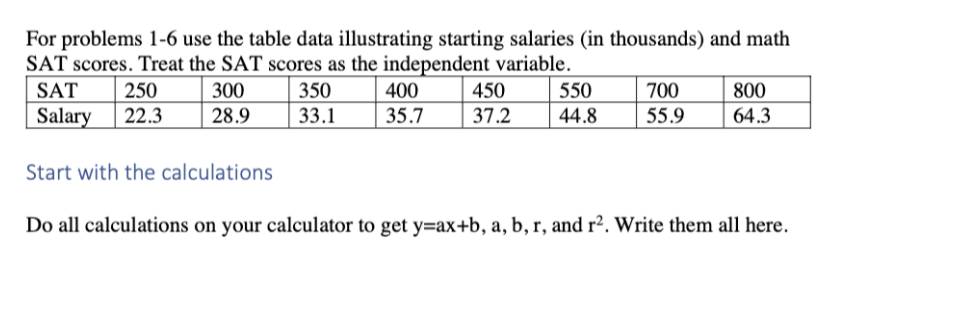
For problems 1-6 use the table data illustrating starting salaries (in thousands) and math SAT scores. Treat the SAT scores as the independent variable. SAT 250 300 350 400 450 550 700 800 Salary 22.3 28.9 33.1 35.7 37.2 44.8 55.9 64.3 Start with the calculations Do all calculations on your calculator to get y=ax+b, a, b, r, and r2. Write them all here.6. Find and interpret the coefficient of determination. 7. (Separate question not relevant to the data) Draw examples of scatter diagrams that could go with the following correlation coefficients: r = .983, r == .572, 1= - .214 and r = -.739
Step by Step Solution
There are 3 Steps involved in it
1 Expert Approved Answer
Step: 1 Unlock

Question Has Been Solved by an Expert!
Get step-by-step solutions from verified subject matter experts
Step: 2 Unlock
Step: 3 Unlock