

Question: For problems 1-6 use the table data illustrating starting salaries (in thousands) and math SAT scores. Treat the SAT scores as the independent variable. SAT
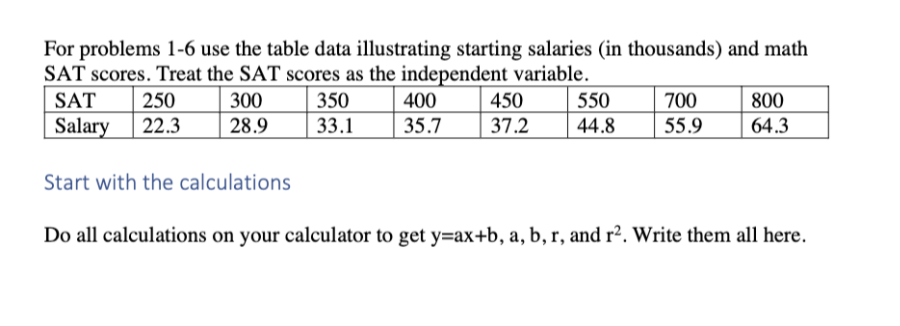
For problems 1-6 use the table data illustrating starting salaries (in thousands) and math SAT scores. Treat the SAT scores as the independent variable. SAT 250 300 350 400 450 550 700 800 Salary 22.3 28.9 33.1 35.7 37.2 44.8 55.9 64.3 Start with the calculations Do all calculations on your calculator to get y=ax+b, a, b, r, and r2. Write them all here.4. Interpret the slope and y-interoept for the least squares regression line. 5. Test if there is a linear relationship between Math SAT scores and starting salaries
Step by Step Solution
There are 3 Steps involved in it
1 Expert Approved Answer
Step: 1 Unlock

Question Has Been Solved by an Expert!
Get step-by-step solutions from verified subject matter experts
Step: 2 Unlock
Step: 3 Unlock