

Question: For problems 1-6 use the table data illustrating starting salaries (in thousands) and math SAT scores. Treat the SAT scores as the independent variable. SAT
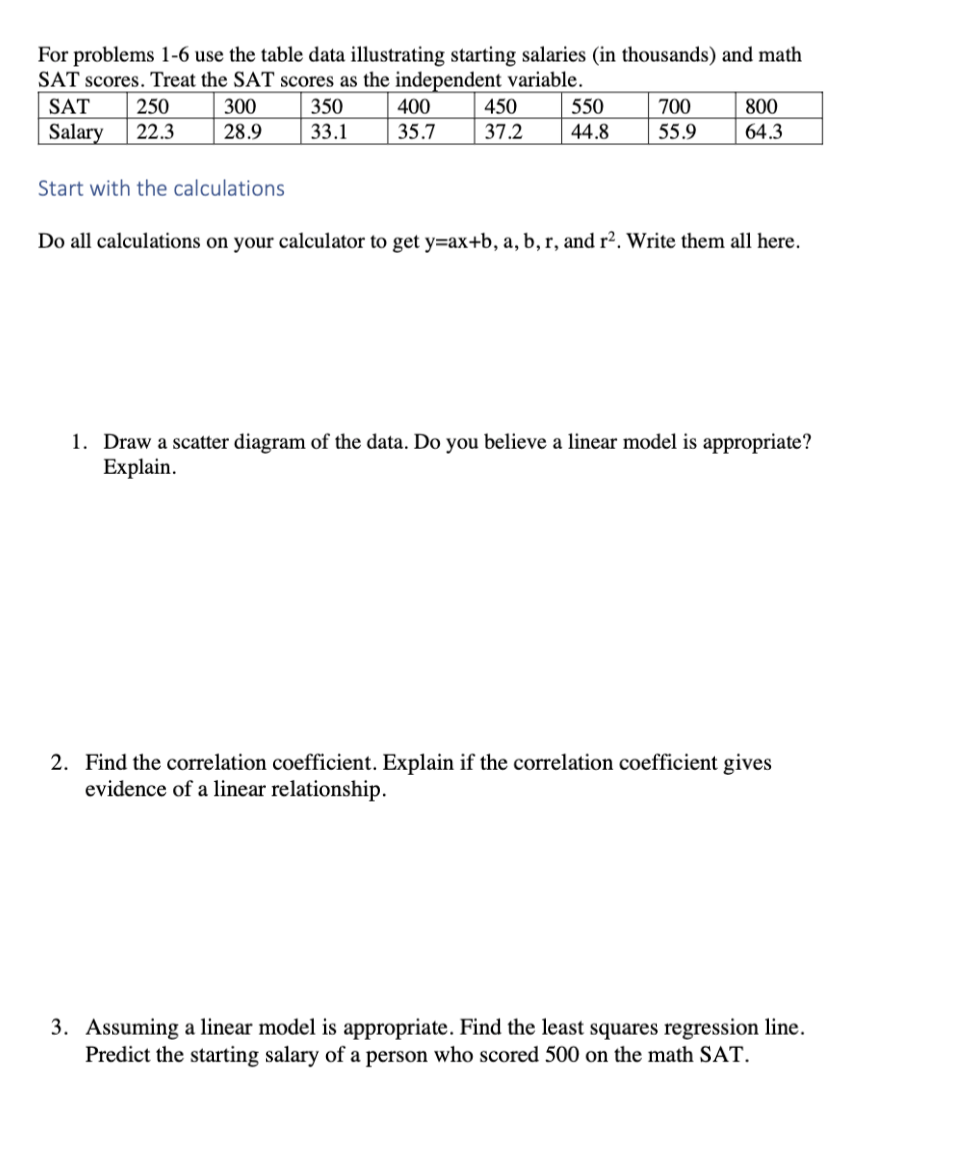
For problems 1-6 use the table data illustrating starting salaries (in thousands) and math SAT scores. Treat the SAT scores as the independent variable. SAT 250 300 350 400 450 550 700 800 Salary 22.3 28.9 33.1 35.7 37.2 44.8 55.9 64.3 Start with the calculations Do all calculations on your calculator to get y=ax+b, a, b, r, and r2. Write them all here. 1. Draw a scatter diagram of the data. Do you believe a linear model is appropriate? Explain. 2. Find the correlation coefficient. Explain if the correlation coefficient gives evidence of a linear relationship. 3. Assuming a linear model is appropriate. Find the least squares regression line. Predict the starting salary of a person who scored 500 on the math SAT
Step by Step Solution
There are 3 Steps involved in it

Get step-by-step solutions from verified subject matter experts