

Question: : For quick access, place your bookmarks here on the bookmarks bar. Import bookmarks now Selected financial data for Bahama Bay and Caribbean Key are
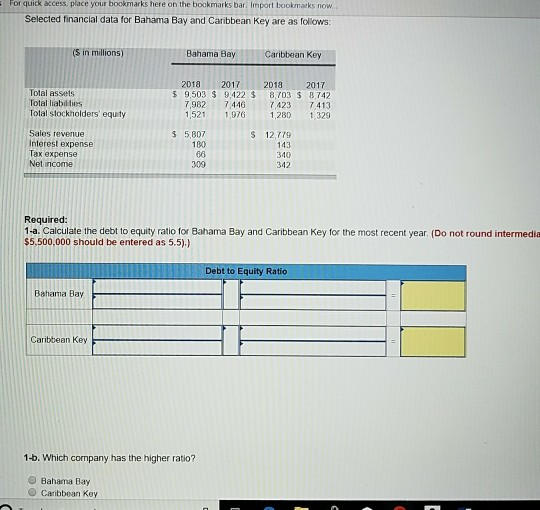
: For quick access, place your bookmarks here on the bookmarks bar. Import bookmarks now Selected financial data for Bahama Bay and Caribbean Key are as follows: (S in millions) Bahama Bay Caribbean Key Total assets Total liabilties Total stockholders' equty 2018 201720182017 9503 $ 9,422 $ 8,703 $ 8,742 7,982 7446 ,423 413 1,521 1,976 1,280 1,329 Sales revenue Interest expense Tax expense Net income $ 5,807 S 12,7r9 143 340 342 180 300 Required: 1-a. Calculate the debt to equity ratio for Bahama Bay and Caribbean Key for the most recent year. (Do not round intermedia $5.500,000 should be entered as 5.5).) Debt to Equity Ratic Bahama Bay Caribbean Key 1-b. Which company has the higher ratio? O Bahama Bay O Caibbean Key
Step by Step Solution
There are 3 Steps involved in it

Get step-by-step solutions from verified subject matter experts