

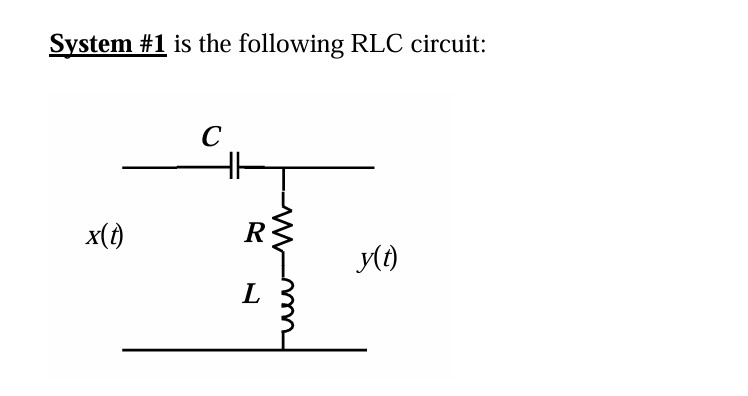
Question: For System # 1 with component values of R = 1 0 0 , L = 1 0 mH , and C = 0 .
For System # with component values of R L mH and C F a Make a Bode plot by hand magnitude onlyb Use MATLABs freqs command to plot both magnitude and phase of the frequency response the frequency axis should be on a log scale and the magnitude should be in dB System # is the following RLC circuit:
Step by Step Solution
There are 3 Steps involved in it
1 Expert Approved Answer
Step: 1 Unlock

Question Has Been Solved by an Expert!
Get step-by-step solutions from verified subject matter experts
Step: 2 Unlock
Step: 3 Unlock