

Question: For the beam shown below, plot the shear force and bending moment diagrams using the graphical method as we did in class. Track calculations
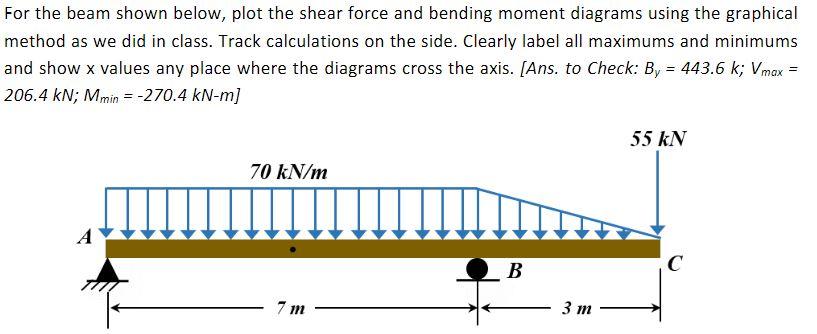
For the beam shown below, plot the shear force and bending moment diagrams using the graphical method as we did in class. Track calculations on the side. Clearly label all maximums and minimums and show x values any place where the diagrams cross the axis. [Ans. to Check: By = 443.6 k; Vmax = 206.4 KN; Mmin = -270.4 kN-m] 70 kN/m 55 kN C B 3 m 7 m
Step by Step Solution
There are 3 Steps involved in it
1 Expert Approved Answer
Step: 1 Unlock

Question Has Been Solved by an Expert!
Get step-by-step solutions from verified subject matter experts
Step: 2 Unlock
Step: 3 Unlock