

Question: For the below graph, and using the data information in it, create a data table in order to organize data for processing by computers or
For the below graph, and using the data information in it, create a data table in order to organize data for processing by computers or for presenting data visually. Next, redraw the below graph, by creating 2 separate graphs in Excel to visualize the data from this below graph and from the table you just created. Use best practices of graphs creation.
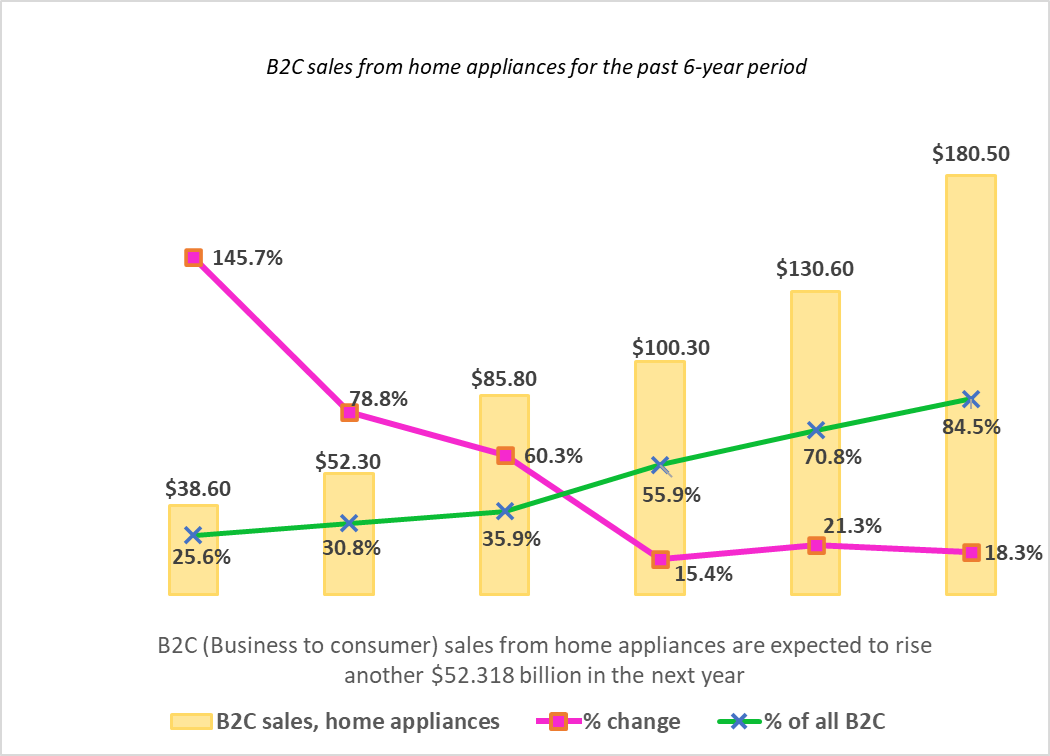
B2C sales from home appliances for the past 6-year period B2C (Business to consumer) sales from home appliances are expected to rise another $52.318 billion in the next year B2C sales, home appliances % change % of all B2C
Step by Step Solution
There are 3 Steps involved in it
1 Expert Approved Answer
Step: 1 Unlock

Question Has Been Solved by an Expert!
Get step-by-step solutions from verified subject matter experts
Step: 2 Unlock
Step: 3 Unlock