

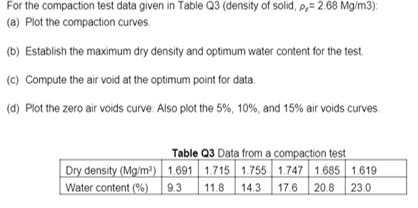
Question: For the compaction test data given in Table Q 3 ( density of solid, s = 2 . 6 8 M g m 3 )
For the compaction test data given in Table Qdensity of solid,
a Plot the compaction curves.
b Establish the maximum dry density and optimum water content for the test.
c Compute the air void at the optimum point for data.
d Plot the zero air voids curve. Also plot the and air voids curves
Table Q Data from a compaction test
Step by Step Solution
There are 3 Steps involved in it
1 Expert Approved Answer
Step: 1 Unlock

Question Has Been Solved by an Expert!
Get step-by-step solutions from verified subject matter experts
Step: 2 Unlock
Step: 3 Unlock