

Question: For the data as stated in table 1 answer the questions that follow: 2. 2. 4. 3. 4. 3. 3. 3. 2 7 2 1

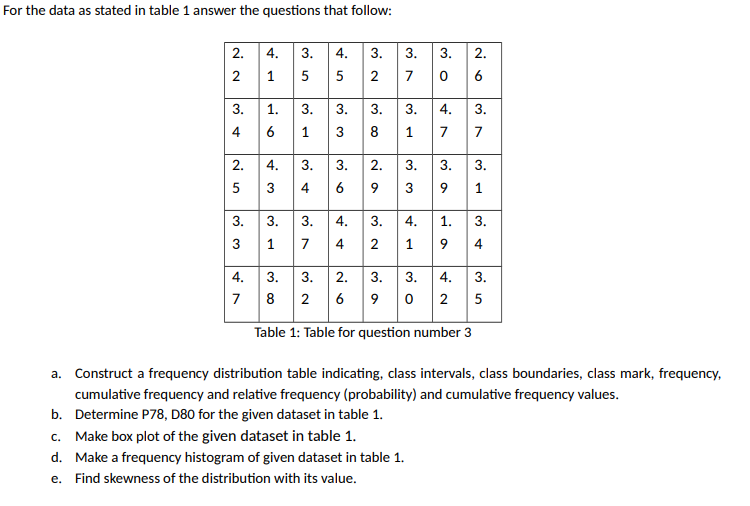
For the data as stated in table 1 answer the questions that follow: 2. 2. 4. 3. 4. 3. 3. 3. 2 7 2 1 5 3. 4. 3. 3. 3. 3. 3. 1. 6 3 8 1 7 4 3. 2. 4. 3. 3. 2. 3. 3. 3 9 3 4 6 9 1 un 3. 3. 3 3. 4. 3 4. 4 1 7 4 2 1 3 4. 3. 4. 3. 3. 2. 3. 3. 5 7 8 2 6 9 0 2 Table 1: Table for question number 3 a. Construct a frequency distribution table indicating, class intervals, class boundaries, class mark, frequency, cumulative frequency and relative frequency (probability) and cumulative frequency values. b. Determine P78, D80 for the given dataset in table 1. c. Make box plot of the given dataset in table 1. d. Make a frequency histogram of given dataset in table 1. e. Find skewness of the distribution with its value
Step by Step Solution
There are 3 Steps involved in it

Get step-by-step solutions from verified subject matter experts