

Question: For the five new samples (101106) listed in the table below, calculate each sample means (X), record them in the sample mean column. According to
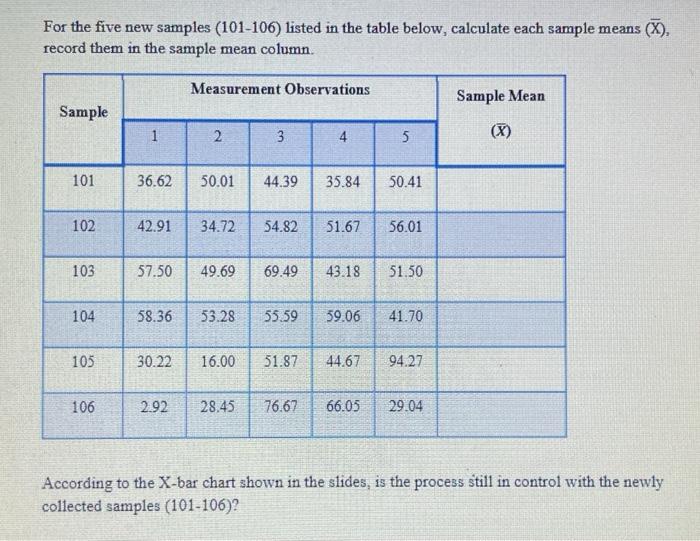
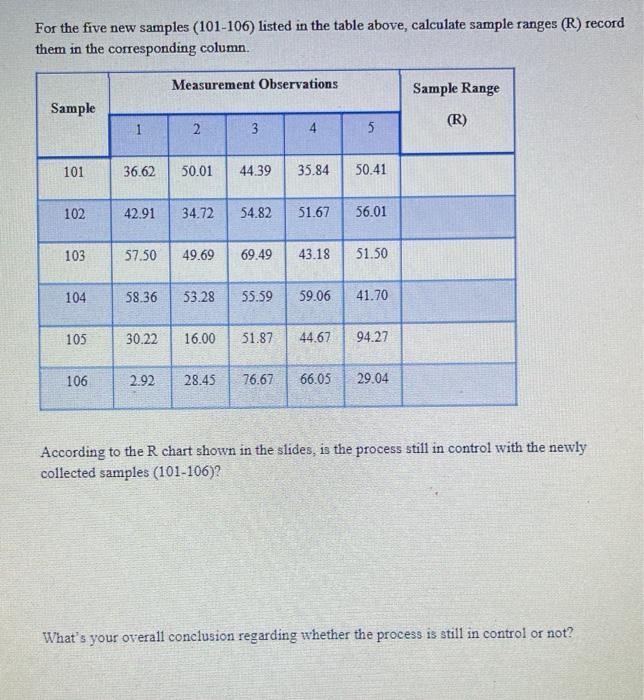
For the five new samples (101106) listed in the table below, calculate each sample means (X), record them in the sample mean column. According to the X-bar chart shown in the slides, is the process still in control with the newly collected samples (101106)? For the five new samples (101-106) listed in the table above, calculate sample ranges (R) record them in the corresponding column. According to the R chart shown in the slides, is the process still in control with the newly collected samples (101-106)? What's your overall conclusion regarding whether the process is still in control or not? For the five new samples (101106) listed in the table below, calculate each sample means (X), record them in the sample mean column. According to the X-bar chart shown in the slides, is the process still in control with the newly collected samples (101106)? For the five new samples (101-106) listed in the table above, calculate sample ranges (R) record them in the corresponding column. According to the R chart shown in the slides, is the process still in control with the newly collected samples (101-106)? What's your overall conclusion regarding whether the process is still in control or not
Step by Step Solution
There are 3 Steps involved in it

Get step-by-step solutions from verified subject matter experts