

Question: For the following data, draw (by hand) the histograms for X1 and X2 and the scatterplot for X1 versus X2. Which variable(s) do think
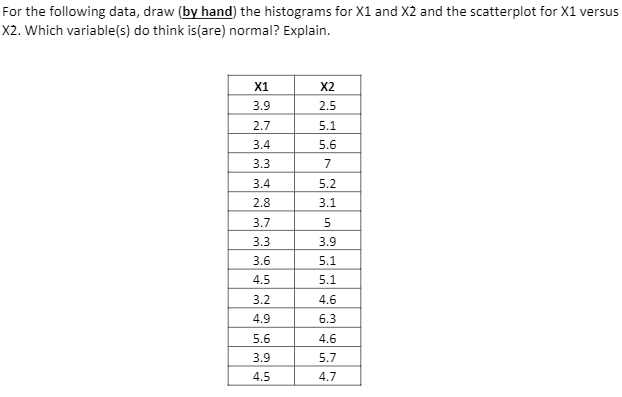
For the following data, draw (by hand) the histograms for X1 and X2 and the scatterplot for X1 versus X2. Which variable(s) do think is (are) normal? Explain. X1 X2 3.9 2.5 2.7 5.1 3.4 5.6 3.3 7 3.4 5.2 2.8 3.1 3.7 5 3.3 3.9 3.6 5.1 4.5 5.1 3.2 4.6 4.9 6.3 5.6 4.6 3.9 5.7 4.5 4.7
Step by Step Solution
There are 3 Steps involved in it
1 Expert Approved Answer
Step: 1 Unlock

Question Has Been Solved by an Expert!
Get step-by-step solutions from verified subject matter experts
Step: 2 Unlock
Step: 3 Unlock