

Question: For the following example: a ) Graph the total cost line b ) Over what range of annual volume is each facility going to have
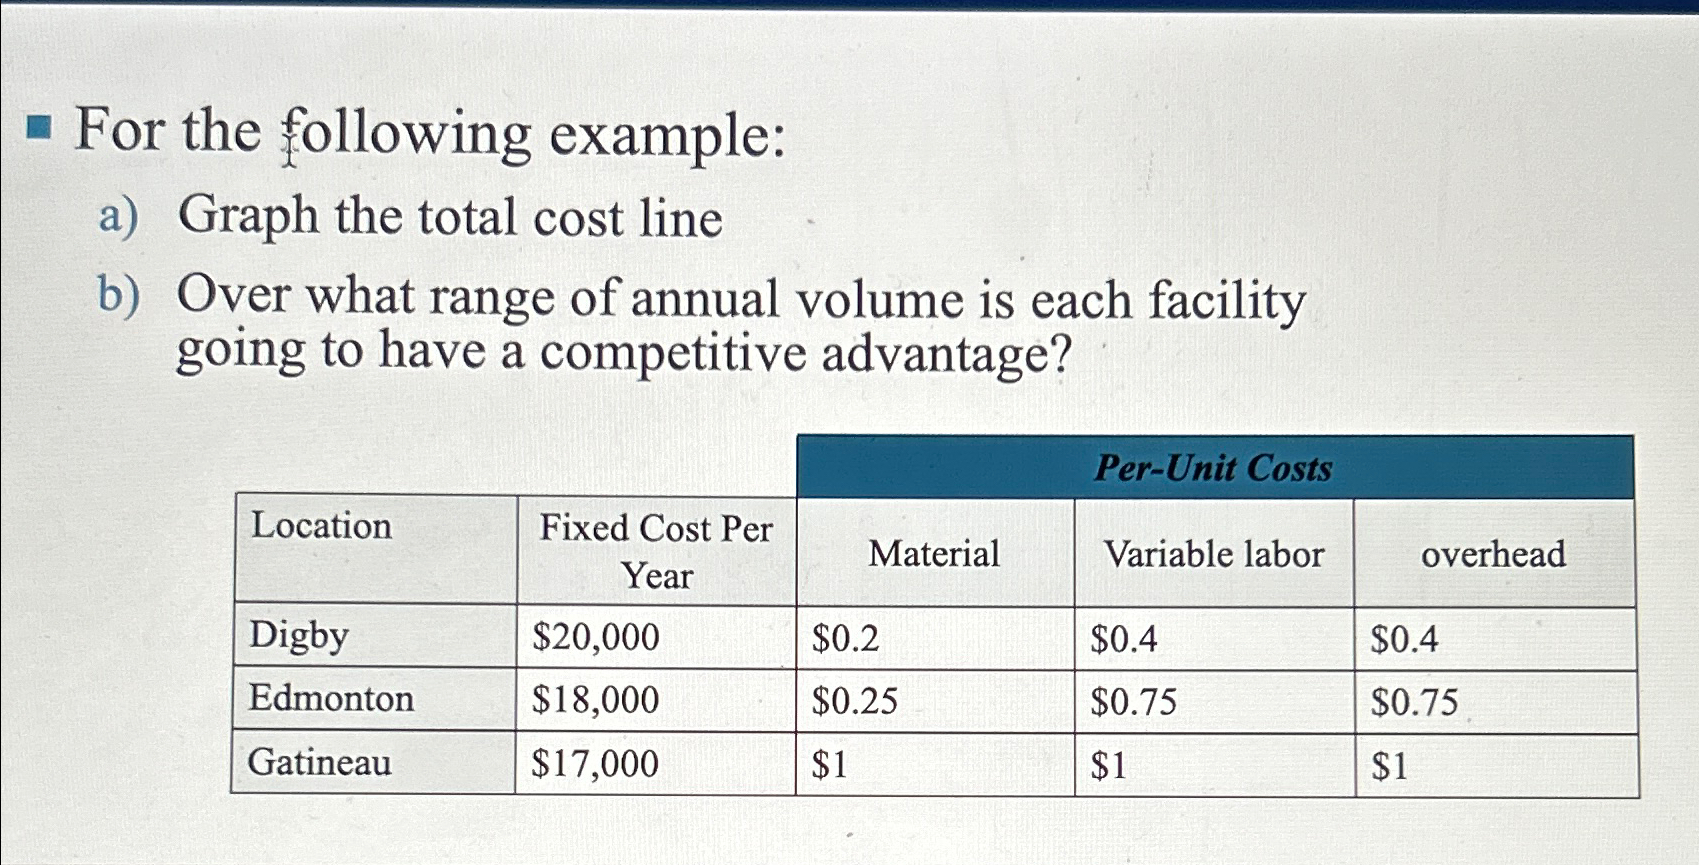
For the following example:
a Graph the total cost line
b Over what range of annual volume is each facility going to have a competitive advantage?
tablePerUnit CostsLocationtableFixed Cost PerYearMaterial,Variable labor,overheadDigby$$$$
Step by Step Solution
There are 3 Steps involved in it
1 Expert Approved Answer
Step: 1 Unlock

Question Has Been Solved by an Expert!
Get step-by-step solutions from verified subject matter experts
Step: 2 Unlock
Step: 3 Unlock