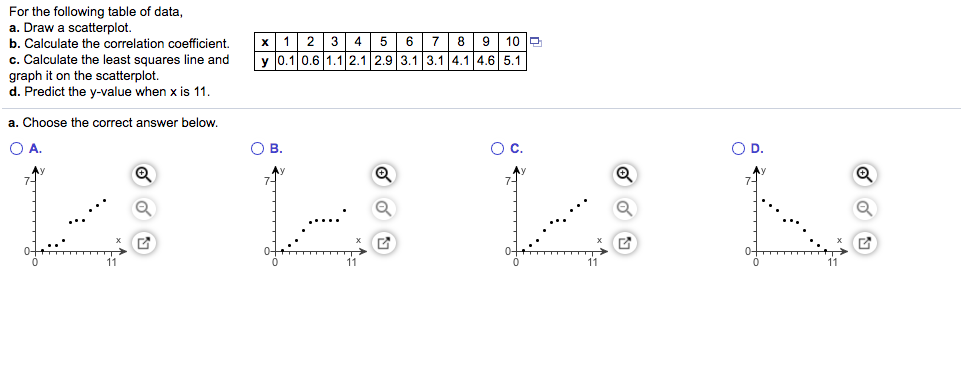
Question: For the following table of data, a. Draw a scatterplot. b. Calculate the correlation coefficient. c. Calculate the least squares line and graph it on

For the following table of data, a. Draw aFor the following table of data, a. Draw a

For the following table of data, a. Draw a scatterplot. b. Calculate the correlation coefficient. c. Calculate the least squares line and graph it on the scatterplot. d. Predict the y-value when x is 11. X1 23 4 5 6 89 10 y 0.1 0.6 1.1 2.1 2.9 3.1 3.1 4.1 4.6 5.1 a. Choose the correct answer below. OA OB OD For the following table of data, a. Draw a scatterplot. b. Calculate the correlation coefficient. c. Calculate the least squares line and graph it on the scatterplot. d. Predict the y-value when x is 11. X 1 2 3 4 5 6 7 8 9 10 y 0.1 0.7 1.1 2.1 2.9 3.1 3.1 4.44.6 5.1 a. Choose the correct answer below. OA B. O c. OD 7- 0 0 0 11

Step by Step Solution

There are 3 Steps involved in it

1 Expert Approved Answer
Step: 1 Unlock blur-text-image
Question Has Been Solved by an Expert!

Get step-by-step solutions from verified subject matter experts

Step: 2 Unlock
Step: 3 Unlock

Students Have Also Explored These Related General Management Questions!