

Question: For the model shown and assuming composite beam behavior, plot a graph of maximum bending tensile stress in the stem at section X-X as a
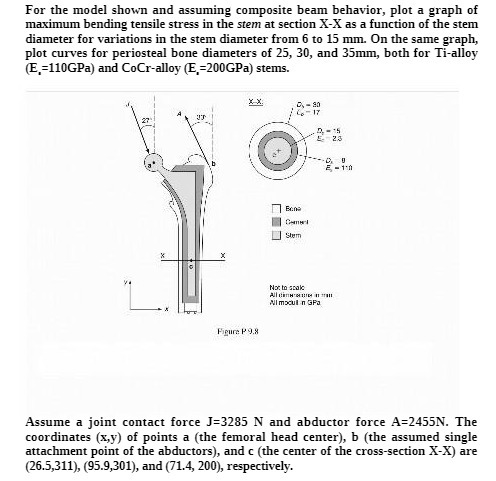

For the model shown and assuming composite beam behavior, plot a graph of maximum bending tensile stress in the stem at section X-X as a function of the stem diameter for variations in the stem diameter from 6 to 15 mm. On the same graph, plot curves for periosteal bone diameters of 25, 30, and 35mm, both for Ti-alloy (E,=110GPa) and CoCr-alloy (E,=200GPa) stems. Dy - 20 27 Stem Not to scale All mocul n GFJ Forum P 9.8 Assume a joint contact force J=3285 N and abductor force A=2455N. The coordinates (x,y) of points a (the femoral head center), b (the assumed single attachment point of the abductors), and c (the center of the cross-section X-X) are (26.5,311), (95.9,301), and (71.4, 200), respectively
Step by Step Solution
There are 3 Steps involved in it

Get step-by-step solutions from verified subject matter experts