

Question: For the network shown in Figure R-2 k2, the dc value of the the output voltage is a) 12.7 V c) 76.3 V e)
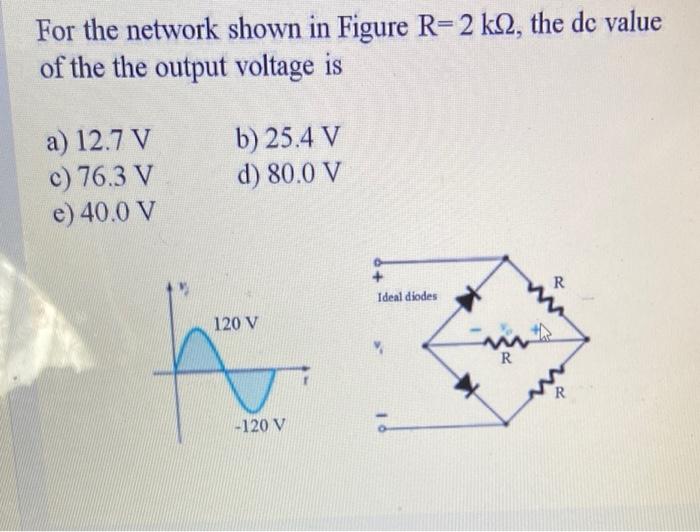
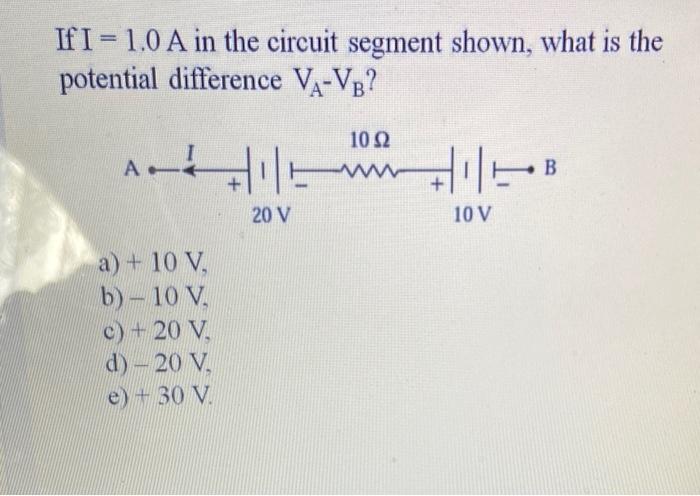
For the network shown in Figure R-2 k2, the dc value of the the output voltage is a) 12.7 V c) 76.3 V e) 40.0 V b) 25.4 V d) 80.0 V 120 V -120 V Ideal diodes R R If I=1.0 A in the circuit segment shown, what is the potential difference V-VB? A a) + 10 V. b) - 10 V c) +20 V. d) - 20 V. e) +30 V 1 20 V 10 52 +1+B 10 V
Step by Step Solution
★★★★★
3.47 Rating (144 Votes )
There are 3 Steps involved in it
1 Expert Approved Answer
Step: 1 Unlock

Question Has Been Solved by an Expert!
Get step-by-step solutions from verified subject matter experts
Step: 2 Unlock
Step: 3 Unlock