

Question: For the next two problems use the following graph: 50 10 60 2 0 10 70 40 3 90 20 20 70 70 50 30
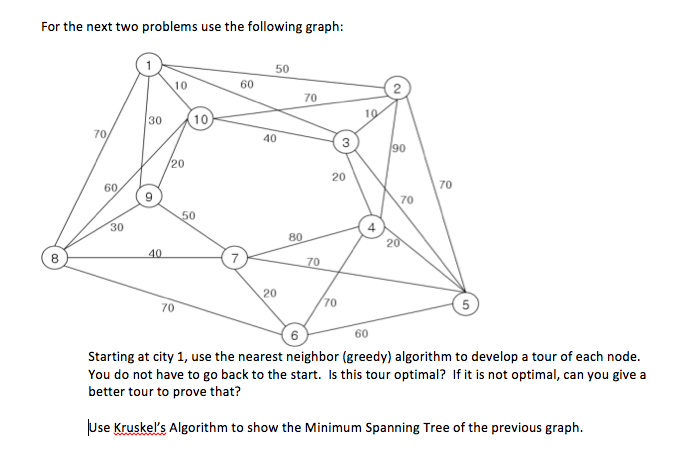
For the next two problems use the following graph: 50 10 60 2 0 10 70 40 3 90 20 20 70 70 50 30 4 80 20 8 70 20 70 70 5 6 60 Starting at city 1, use the nearest neighbor (greedy) algorithm to develop a tour of each node. You do not have to go back to the start. Is this tour optimal? If it is not optimal, can you give a better tour to prove that? Use Kruskel's Algorithm to show the Minimum Spanning Tree of the previous graph
Step by Step Solution
There are 3 Steps involved in it
1 Expert Approved Answer
Step: 1 Unlock

Question Has Been Solved by an Expert!
Get step-by-step solutions from verified subject matter experts
Step: 2 Unlock
Step: 3 Unlock