

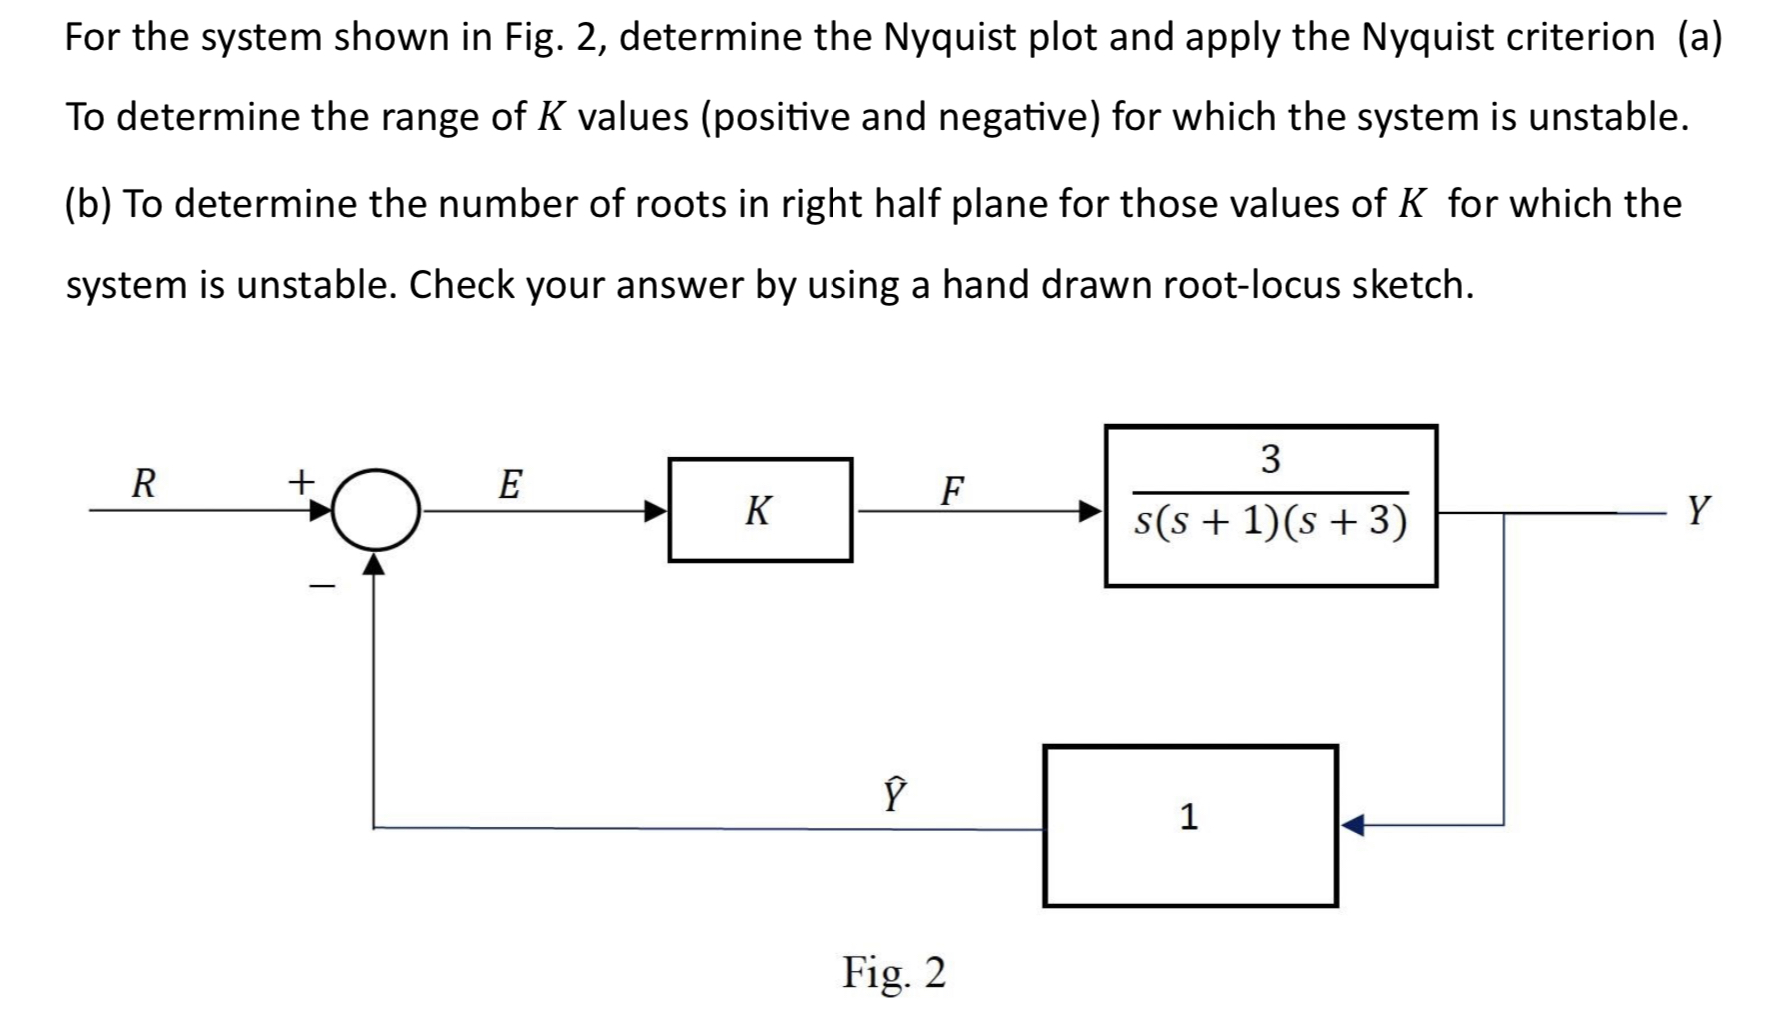
Question: For the system shown in Fig. 2 , determine the Nyquist plot and apply the Nyquist criterion ( a ) To determine the range of
For the system shown in Fig. determine the Nyquist plot and apply the Nyquist criterion a To determine the range of K values positive and negative for which the system is unstable.
b To determine the number of roots in right half plane for those values of K for which the system is unstable. Check your answer by using a hand drawn rootlocus sketch.
Fig.
Step by Step Solution
There are 3 Steps involved in it
1 Expert Approved Answer
Step: 1 Unlock

Question Has Been Solved by an Expert!
Get step-by-step solutions from verified subject matter experts
Step: 2 Unlock
Step: 3 Unlock