

Question: For this problem, you can use native Python, as well as the math, numpy, and mat-plotlib libraries. One way to measure the diffusivity of an
For this problem, you can use native Python, as well as the math, numpy, and mat-plotlib libraries.
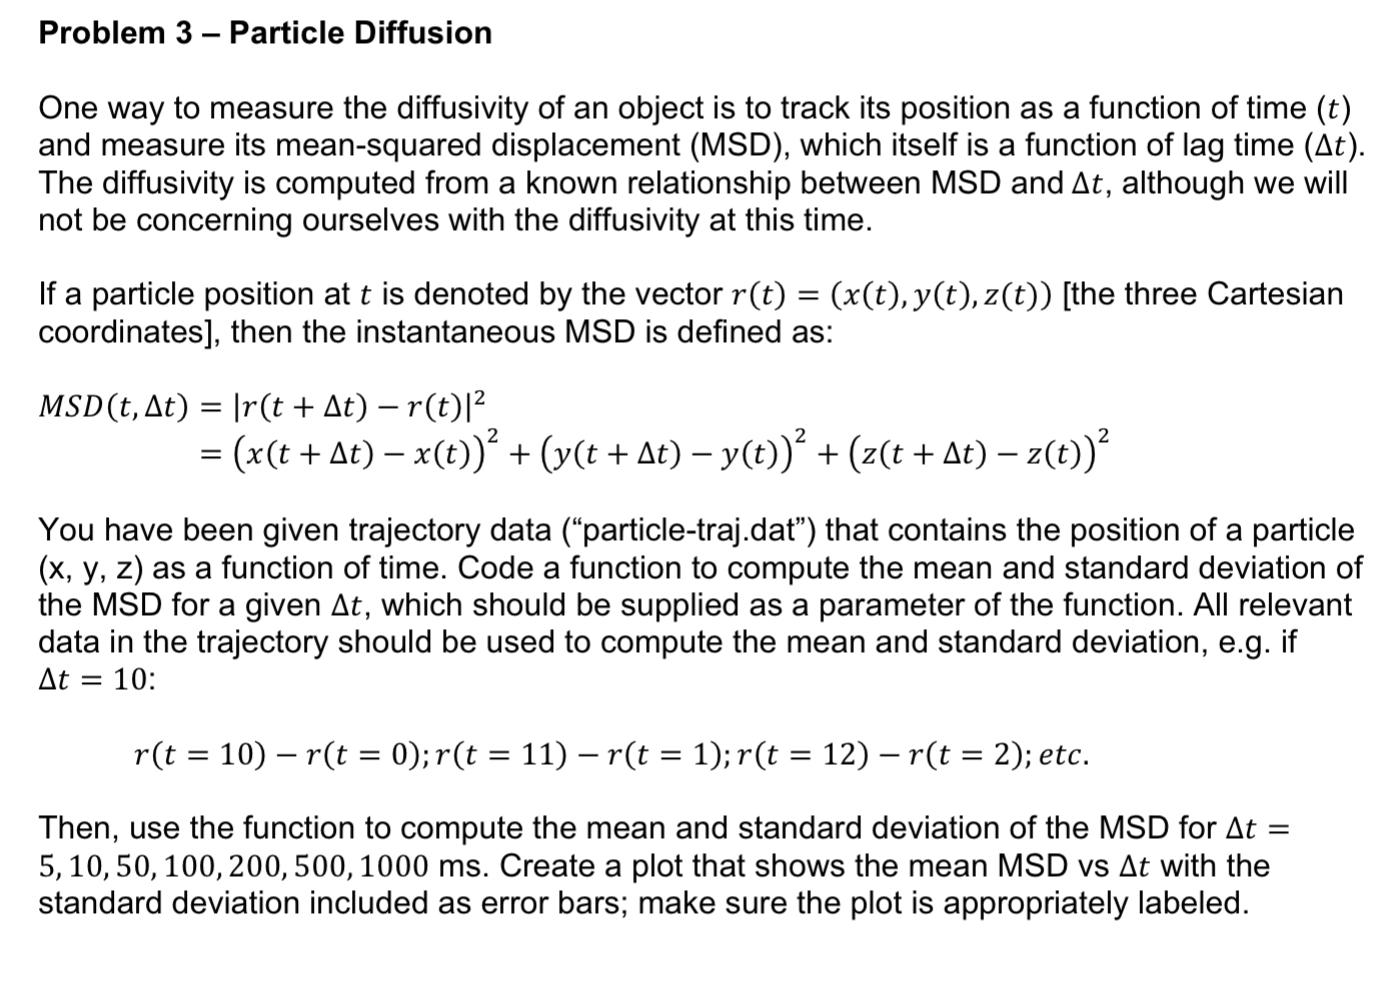
One way to measure the diffusivity of an object is to track its position as a function of time (t) and measure its mean-squared displacement (MSD), which itself is a function of lag time (t). The diffusivity is computed from a known relationship between MSD and t, although we will not be concerning ourselves with the diffusivity at this time. If a particle position at t is denoted by the vector r(t)=(x(t),y(t),z(t)) [the three Cartesian coordinates], then the instantaneous MSD is defined as: MSD(t,t)=r(t+t)r(t)2=(x(t+t)x(t))2+(y(t+t)y(t))2+(z(t+t)z(t))2 You have been given trajectory data ("particle-traj.dat") that contains the position of a particle (x,y,z) as a function of time. Code a function to compute the mean and standard deviation of the MSD for a given t, which should be supplied as a parameter of the function. All relevant data in the trajectory should be used to compute the mean and standard deviation, e.g. if t=10 : r(t=10)r(t=0);r(t=11)r(t=1);r(t=12)r(t=2);etc. Then, use the function to compute the mean and standard deviation of the MSD for t= 5,10,50,100,200,500,1000ms. Create a plot that shows the mean MSD vs t with the standard deviation included as error bars; make sure the plot is appropriately labeled
Step by Step Solution
There are 3 Steps involved in it

Get step-by-step solutions from verified subject matter experts