

Question: Forecast Error Calculations MAD (Ex. 4 pg 118), MSE (Ex. 5 pg 119) and MAPE (Ex. 6 pg 120) Assignment: Enter formulas in the shaded
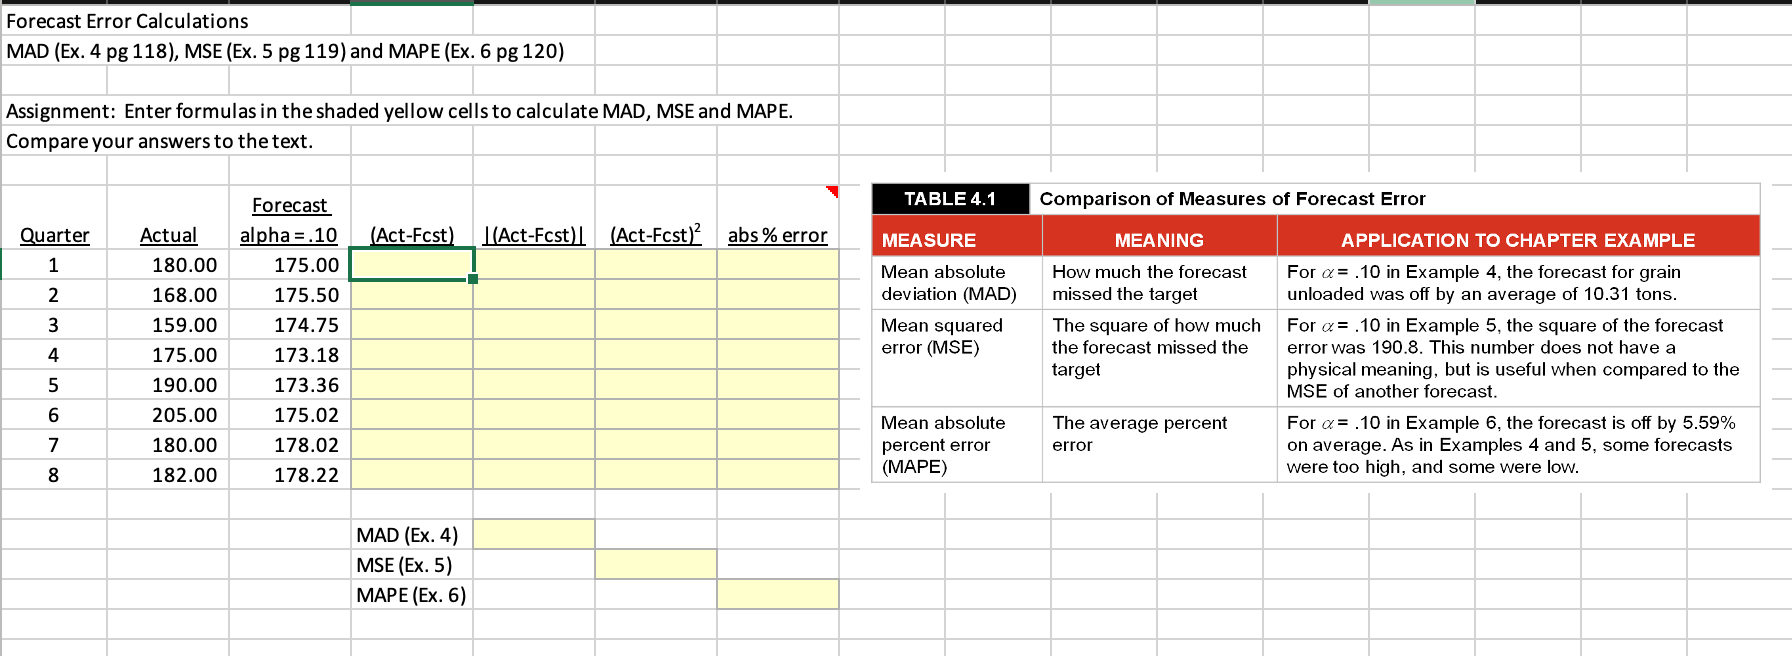
Forecast Error Calculations MAD (Ex. 4 pg 118), MSE (Ex. 5 pg 119) and MAPE (Ex. 6 pg 120) Assignment: Enter formulas in the shaded yellow cells to calculate MAD, MSE and MAPE. Compare your answers to the text. Quarter Actual alpha =.10 (Act-Fcst) (Act-Fcst) (Act-Fcst) 2 abs\% error 1 180.00 175.00 2 168.00 175.50 \begin{tabular}{|l|l|} 159.00 & 174.75 \\ \hline \end{tabular} \begin{tabular}{|l|l|} 175.00 & 173.18 \\ \hline \end{tabular} 190.00 173.36 205.00 175.02 180.00 178.02 182.00 178.22 MAD (Ex. 4) MSE (Ex. 5) MAPE (Ex. 6) TABLE 4.1 MEASURE Mean absolute deviation (MAD) Mean squared error (MSE) Mean absolute percent error (MAPE) Comparison of Measures of Forecast Error APPLICATION TO CHAPTER EXAMPLE For =.10 in Example 4, the forecast for grain unloaded was off by an average of 10.31 tons. For =.10 in Example 5, the square of the forecast error was 190.8. This number does not have a physical meaning, but is useful when compared to the MSE of another forecast. For =.10 in Example 6, the forecast is off by 5.59% on average. As in Examples 4 and 5, some forecasts were too high, and some were low
Step by Step Solution
There are 3 Steps involved in it

Get step-by-step solutions from verified subject matter experts