

Four supply and demand graphs show shifts in the supply and demand curves. All four graphs have
Fantastic news! We've Found the answer you've been seeking!
Question:
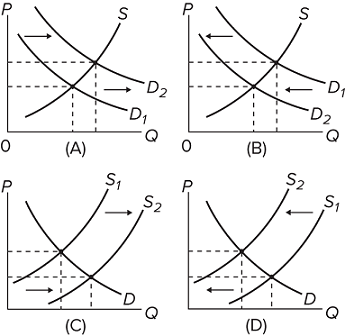 Four supply and demand graphs show shifts in the supply and demand curves. All four graphs have P (price) on the vertical axis and Q (quantity) on the horizontal axis. In Graph A, D 1 shifts right to D 2 along a stable supply curve S. In Graph B, D 1 shifts left to D 2 along a stable supply curve S. In Graph C, S 1 shifts right to S 2 along a stable demand curve D. In Graph D, S 1 shifts left to S 2 along a stable demand curve D.
Which of the diagrams illustrates the effect of an increase in automobile worker wages on the market for automobiles?
Expert Answer:
The detailed answer for the above question is provided below Ans D only Explanati... View the full answer

Related Book For 

Intermediate Microeconomics and Its Application
ISBN: 978-0324599107
11th edition
Authors: walter nicholson, christopher snyder
Posted Date:
