

Question: The horizontal axis is labeled quantity. The vertical axis is labeled price. Two downward sloping curves marked D 1 and D 2 are plotted. Curve
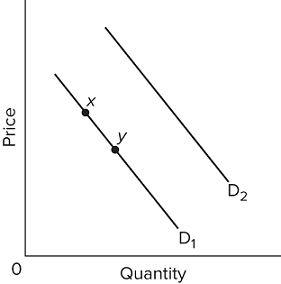
The horizontal axis is labeled quantity. The vertical axis is labeled price. Two downward sloping curves marked D 1 and D 2 are plotted. Curve D 1 lies below curve D 2 and these curves do not touch the axes at any point. Points x and y are marked on curve D 1. Point y lies down and to the right of point x. The lines don't touch the axes at any point.
Suppose that tacos and pizza are substitutes, and that soda and pizza are complements. We would expect an increase in the price of pizza to
Price 0 D Quantity D
Step by Step Solution
3.47 Rating (160 Votes )
There are 3 Steps involved in it
The detailed answer for the above question is provided below The correct an... View full answer

Get step-by-step solutions from verified subject matter experts