

Question: fPOSSIBLE POINTS: 5 Which equation represents the graph below? -5- -15 -10 -5 0 5 10 -5 Oy = - Ex +3 Oy = -5x
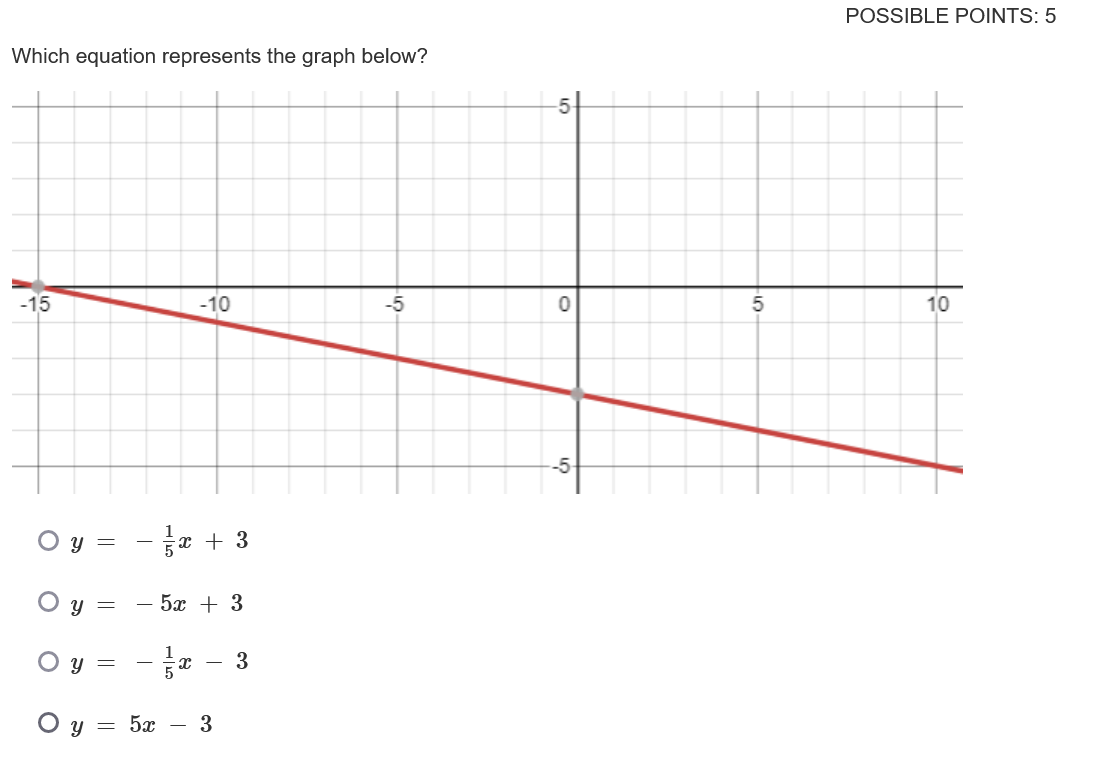
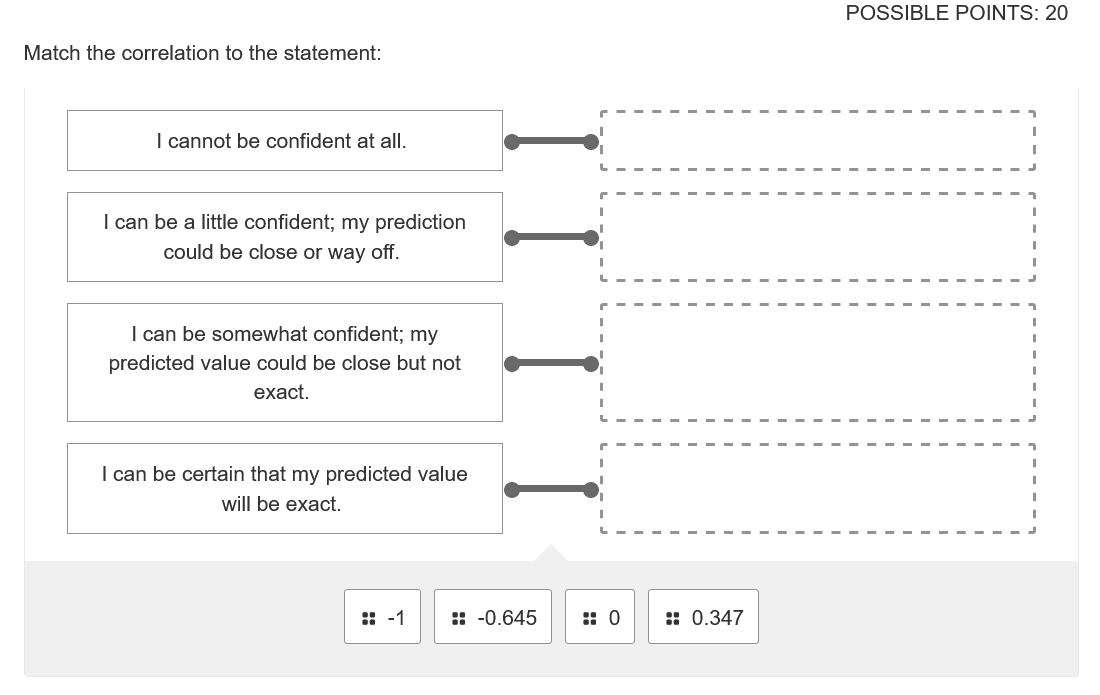
\fPOSSIBLE POINTS: 5 Which equation represents the graph below? -5- -15 -10 -5 0 5 10 -5 Oy = - Ex +3 Oy = -5x + 3 Oy = - =x- 3 Oy = 5x - 3POSSIBLE POINTS: 20 Match the correlation to the statement: I cannot be confident at all. L I can be a little confident; my prediction could be close or way off. L I can be somewhat confident; my predicted value could be close but not exact. I can be certain that my predicted value will be exact. -1 -0.645 :: 0 #: 0.347
Step by Step Solution
There are 3 Steps involved in it
1 Expert Approved Answer
Step: 1 Unlock

Question Has Been Solved by an Expert!
Get step-by-step solutions from verified subject matter experts
Step: 2 Unlock
Step: 3 Unlock