

Question: . From Fig. 12.15 as well as table 129 it is clear that it is necessary to tightly control only 20% of the inventory items
.
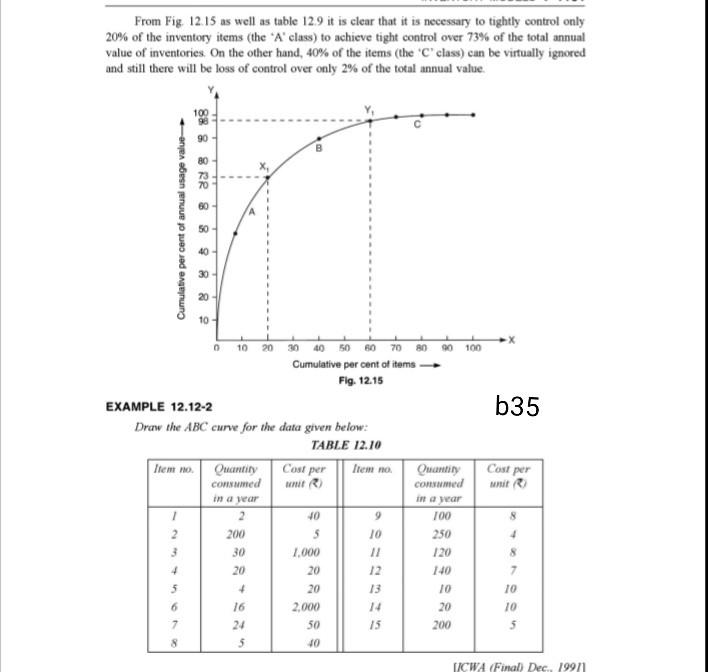
From Fig. 12.15 as well as table 129 it is clear that it is necessary to tightly control only 20% of the inventory items (the 'A' class) to achieve tight control over 73% of the total annual value of inventories. On the other hand, 40% of the items (the "C" class) can be virtually ignored and still there will be loss of control over only 2% of the total annual value. Cumulative per cent of annual usage value 88 8 8 RR 8 3 40 20 10 0 10 20 30 40 50 60 70 80 90 100 Cumulative per cent of items Fig. 12.15 EXAMPLE 12.12-2 b35 Draw the ABC curve for the data given below: TABLE 12.10 Item no Quantity Cost per Item no Quantity Cost per consumed mit R) Commed wait in a year in a year 1 2 JO 9 100 8 2 200 5 10 250 4 3 30 1.000 11 120 8 + 20 20 12 10 7 5 + 20 13 10 10 6 16 2,000 14 20 10 7 24 50 15 200 5 8 5 JO ICWA (Final) Dec, 1991Step by Step Solution
There are 3 Steps involved in it
1 Expert Approved Answer
Step: 1 Unlock

Question Has Been Solved by an Expert!
Get step-by-step solutions from verified subject matter experts
Step: 2 Unlock
Step: 3 Unlock