

Question: from table below:- To find the most profitable project among a set of potential candidates: a) Evaluate them using AW if they have different lives,
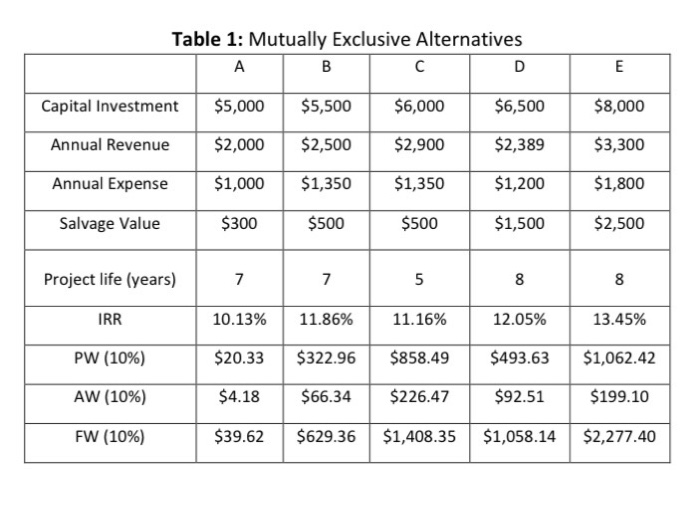
Table 1: Mutually Exclusive Alternatives A B D E Capital Investment $5,000 $5,500 $6,000 $6,500 $8,000 Annual Revenue $2,000 $2,500 $2,900 $2,389 $3,300 Annual Expense $1,000 $1,350 $1,350 $1,200 $1,800 Salvage Value $300 $500 $500 $1,500 $2,500 Project life (years) 7 7 5 8 8 IRR 10.13% 11.86% 11.16% 12.05% 13.45% PW (10%) $20.33 $322.96 $858.49 $493.63 $1,062.42 AW (10%) $4.18 $66.34 $226.47 $92.51 $199.10 FW (10%) $39.62 $629.36 $1,408.35 $1,058.14 $2,277.40 Table 1: Mutually Exclusive Alternatives A B D E Capital Investment $5,000 $5,500 $6,000 $6,500 $8,000 Annual Revenue $2,000 $2,500 $2,900 $2,389 $3,300 Annual Expense $1,000 $1,350 $1,350 $1,200 $1,800 Salvage Value $300 $500 $500 $1,500 $2,500 Project life (years) 7 7 5 8 8 IRR 10.13% 11.86% 11.16% 12.05% 13.45% PW (10%) $20.33 $322.96 $858.49 $493.63 $1,062.42 AW (10%) $4.18 $66.34 $226.47 $92.51 $199.10 FW (10%) $39.62 $629.36 $1,408.35 $1,058.14 $2,277.40
Step by Step Solution
There are 3 Steps involved in it

Get step-by-step solutions from verified subject matter experts