

Question: ? From the data below, calculate the upper and lower Bollinger bands, which represent plus (or minus) two standard deviations of the 20-day simple moving
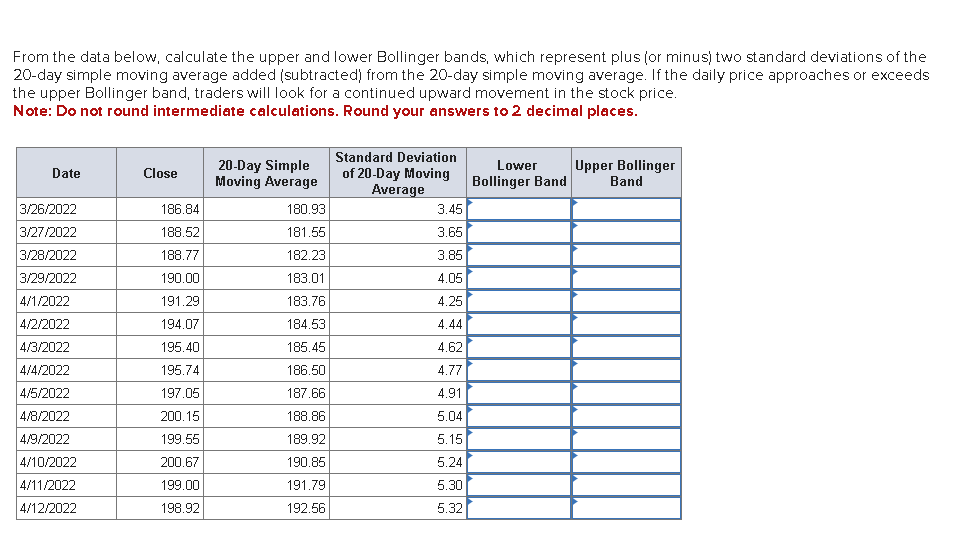
From the data below, calculate the upper and lower Bollinger bands, which represent plus (or minus) two standard deviations of the 20-day simple moving average added (subtracted) from the 20-day simple moving average. If the daily price approaches or exceeds the upper Bollinger band, traders will look for a continued upward movement in the stock price. Note: Do not round intermediate calculations. Round your answers to 2 decimal places. Date Close 20-Day Simple Moving Average Standard Deviation of 20-Day Moving Lower Bollinger Band Upper Bollinger Band Average 3/26/2022 186.84 180.93 3.45 3/27/2022 188.52 181.55 3.65 3/28/2022 188.77 182.23 3.85 3/29/2022 190.00 183.01 4.05 4/1/2022 191.29 183.76 4.25 4/2/2022 194.07 184.53 4.44 4/3/2022 195.40 185.45 4.62 4/4/2022 195.74 186.50 4.77 4/5/2022 197.05 187.66 4.91 4/8/2022 200.15 188.86 5.04 4/9/2022 199.55 189.92 5.15 4/10/2022 200.67 190.85 5.24 4/11/2022 199.00 191.79 5.30 4/12/2022 198.92 192.56 5.32
Step by Step Solution
There are 3 Steps involved in it

Get step-by-step solutions from verified subject matter experts