

Question: From the data below for Apple (AAPL) stock, calculate the upper and lower Bollinger bands, which represent plus or minuto standard deviations of the 20
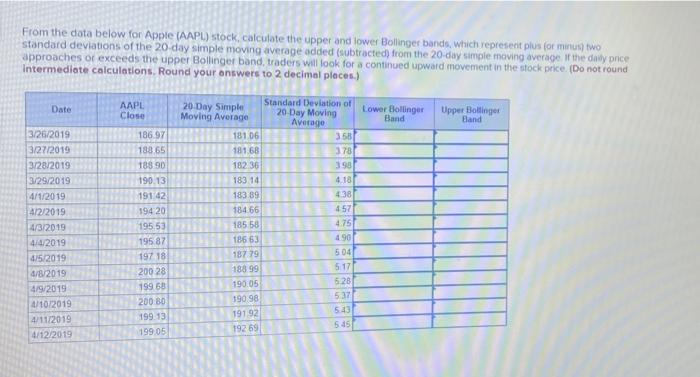
From the data below for Apple (AAPL) stock, calculate the upper and lower Bollinger bands, which represent plus or minuto standard deviations of the 20 day simple moving average added (subtracted from the 20 day simple moving average of the daily price approaches or exceeds the upper Bollinger band, traders will look for a continued upward movement in the stock price (Do not round Intermediate calculations. Round your answers to 2 decimal places) Date AAPL Close Lower Bollinger Band Upper Bollinger Bland 3/26/2019 3/27/2019 3/28/2019 186.97 183 65 189 90 190.13 Standard Deviation of 20 Day Simple Moving Average 20 Day Moving Average 18106 358 181 68 378 182 36 398 3/29/2019 183 14 4.18 4/1/2019 19142 4.38 194 20 457 412/2019 4/3/2019 4/4/2019 195.53 4.75 490 195 87 504 4/5/2019 183.89 184.66 185 58 18663 18779 188 99 190.05 190.98 191 92 192 69 517 4/8/2019 197 18 20028 199 68 200 80 199.13 19905 5.28 537 4/9/2015 4/10/2019 4/11/2019 543 545 4/12/2019
Step by Step Solution
There are 3 Steps involved in it

Get step-by-step solutions from verified subject matter experts