

Question: From this information provided below these are the questions I am trying to answer: Findings : What were the pertinent findings of your analysis? How
From this information provided below these are the questions I am trying to answer:
Findings: What were the pertinent findings of your analysis? How did you arrive at your decisions, and how did you use this information to calculate working capital for the company?
Recommendations: What recommendations would you make to improve the situation for the company? Briefly describe your recommendation
Here are your final metrics:
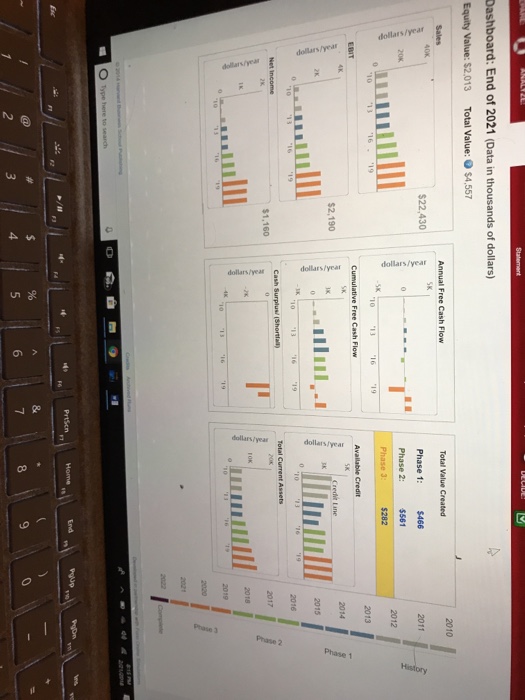
Sales:$22,430
EBIT:$2,190
Net Income:$1,160
Free Cash Flow:$1,314
Equity Value:$2,013
Total Firm Value:$4,557
(data in thousands of dollars)
Balance Sheet
History
Phase 1
Phase 2
Phase 3
| (data in thousands of dollars) | 2018 | 2019 | 2020 | 2021 |
|---|---|---|---|---|
| Minimum Cash Requirement | $300 | $300 | $300 | $300 |
| Cash & Equivalents (Shortfall)* | $0 | -$2,252 | -$1,092 | $0 |
| Accounts Receivable | $4,310 | $6,832 | $6,832 | $6,832 |
| Inventories | $3,917 | $4,967 | $4,967 | $4,967 |
| Other CA | $0 | $0 | $0 | $0 |
| Total Current Assets | $8,528 | $9,847 | $11,007 | $12,099 |
| Net PP&E | $40 | $40 | $40 | $40 |
| Other FA | $0 | $0 | $0 | $0 |
| Total Assets | $8,568 | $9,887 | $11,047 | $12,139 |
| Accounts Payable | $1,793 | $947 | $947 | $947 |
| Acrued Expenses | $0 | $0 | $0 | $0 |
| Total Current Liabilities | $1,793 | $947 | $947 | $947 |
| Amount Borrowed from Credit Line | $2,241 | $3,200 | $3,200 | $3,132 |
| Total Liabilities | $4,034 | $4,147 | $4,147 | $4,079 |
| Common Stock | $200 | $200 | $200 | $200 |
| Retained Earnings | $4,334 | $5,540 | $6,700 | $7,860 |
| Total Stockholder's Equity | $4,534 | $5,740 | $6,900 | $8,060 |
| Total Liabilities & Equity | $8,568 | $9,887 | $11,047 | $12,139 |
ncome Statement
History
Phase 1
Phase 2
Phase 3
| (data in thousands of dollars) | 2018 | 2019 | 2020 | 2021 |
|---|---|---|---|---|
| Sales | $17,254 | $22,430 | $22,430 | $22,430 |
| Cost of Sales | $15,964 | $20,240 | $20,240 | $20,240 |
| EBIT | $1,289 | $2,189 | $2,189 | $2,189 |
| Interest Expense | $199 | $179 | $256 | $256 |
| Pre-Tax Income | $1,091 | $2,010 | $1,933 | $1,933 |
| Income Taxes | $436 | $804 | $773 | $773 |
| Net Income | $654 | $1,206 | $1,160 | $1,160
|
Cash Flow
History
Phase 1
Phase 2
Phase 3
| (data in thousands of dollars) | 2018 | 2019 | 2020 | 2021 |
|---|---|---|---|---|
| Net Income | $654 | $1,206 | $1,160 | $1,160 |
| Depreciation | $0 | $0 | $0 | $0 |
| Change in Account Receivable | -$279 | -$2,522 | $0 | $0 |
| Change in Inventories | -$251 | -$1,049 | $0 | $0 |
| Change in Other CA | $0 | $0 | $0 | $0 |
| Change in Account Payable | $117 | -$846 | $0 | $0 |
| Change in Accrued Expenses | $0 | $0 | $0 | $0 |
| Cash Flow from Operations | 241.70 | -3,211.18 | 1,160.37 | 1,160.37 |
| CAPEX | $0 | $0 | $0 | $0 |
| Cash Flow from Investments | $0 | $0 | $0 | $0 |
| Change in Credit Line | -$241 | $959 | $0 | -$68 |
| Equity Issuance | $0 | $0 | $0 | $0 |
| Dividends | $0 | $0 | $0 | $0 |
| Cash Flow from Financing | -$241 | $959 | $0 | -$68 |
| Net Cash Flow | $0 | -$2,252 | $1,160 | $1,092 |
| Beginning Excess Cash and Cash Equivalents | $0 | $0 | -$2,252 | -$1,092 |
| Ending Cash and Equivalents | $0 | -$2,252 | -$1,092 | $0 |
Dashboard: End of 2021 (Data in thousands of dollars) Equity Value: $2.013 Total Value:$4,557 Annual Free Cash Flow 2010 Total Value Created Phase 1: $466 Phase 2: $561 $22,430 2011 2012 2013 $2,190 2014 2015 2016 $1,160 2017 2018 ml 2019 O Type here to End 7 2 6 9 Dashboard: End of 2021 (Data in thousands of dollars) Equity Value: $2.013 Total Value:$4,557 Annual Free Cash Flow 2010 Total Value Created Phase 1: $466 Phase 2: $561 $22,430 2011 2012 2013 $2,190 2014 2015 2016 $1,160 2017 2018 ml 2019 O Type here to End 7 2 6 9
Step by Step Solution
There are 3 Steps involved in it

Get step-by-step solutions from verified subject matter experts