

The srn_pcp.txt file is a text file that contains monthly precipitation from 1895 through January 2005. The
Question:
The srn_pcp.txt file is a text file that contains monthly precipitation from 1895 through January 2005. The srn_data.txt is a “data dictionary” that explains the precipitation file. (The data dictionary mentions two other files, srn_tmp.txt and srn_pdsi.txt. These files are available but they aren’t used here.) Proceed as follows.
a. Use Power Query to import the precipitation data into an Excel table (not a Data Model). Use the Query Editor for only one purpose, to change the data type for column 1 to text. (You can do this with the Data Type dropdown on the Transform ribbon.)
b. In Excel, change the column headings for columns 2 to 13 to month names: Jan, Feb, etc. Also, delete the last column, which is empty.
c. Create two new columns to the right of column 1: Code and Year. Fill the Code column with the first three digits of the column 1 value, using Excel’s LEFT function, and fill the Year column with the last four digits of the column 1 value, using Excel’s RIGHT function. Then copy the Code and Year columns, paste them over themselves as values, and delete column 1, which is no longer necessary.
d. Scan down to any year 2005 row. Only January’s precipitation is listed. The rest are missing, denoted by the code -99.9. Perform a search and replace for -99.9, replacing each with a blank.
e. The codes in the Code column are 001 to 048 for the contiguous 48 states. The other codes, above 100, are for regions. Delete all rows with these region codes.
f. The State Codes.xlsx file contains a table of codes and the corresponding states. Copy its data somewhere to the right of the imported precipitation data. Then insert a new column, State, to the right of the precipitation Code column and use a VLOOKUP function to fill it with the state names. Copy the State column and paste it over itself as values. Then the columns you copied from the State Codes file are no longer needed, so you can delete them. You can also delete the Code column.
g. Save this Excel file as Precip Data.xlsx. It should have 14 columns: State, Year, and a column for each month.
h. Open Tableau Public and import the data from the Excel file you just created.
i. The data aren’t structured well for analysis. It would be better to have four columns: State, Year, Month, and Precip. Tableau Public has a “pivot” tool for restructuring. Highlight all month columns and select Pivot from the dropdown arrow above any month’s heading. This collapses the month columns into two long columns, which you can rename Month and Precip.
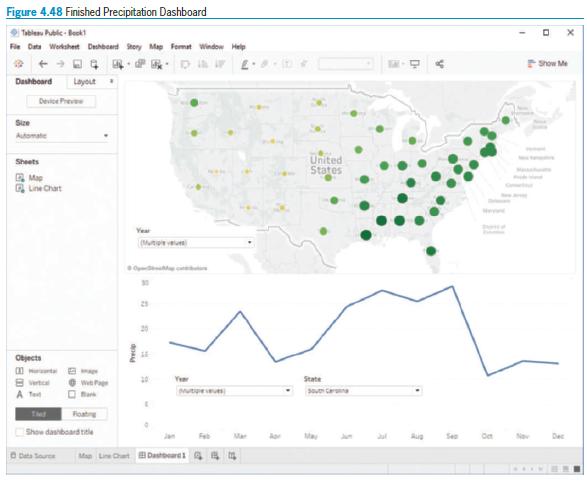
j. Now that the data are in the proper form, create two charts and a dashboard from them that should look approximately like Figure 4.48. The bubbles in the map are sized and colored according to total precipitation in any selected year(s), and the line chart shows total precipitation by month for any selected year(s) and state(s).
Figure 4.48
Step by Step Answer:


Business Analytics Data Analysis And Decision Making
ISBN: 9780357109953
7th Edition
Authors: S. Christian Albright, Wayne L. Winston
