

g Eon Industries is deciding whether to automate one phase of its production process. The manufacturing...
Fantastic news! We've Found the answer you've been seeking!
Question:
Transcribed Image Text:
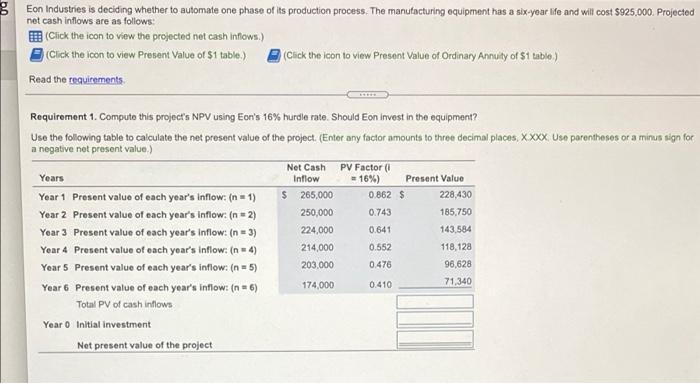
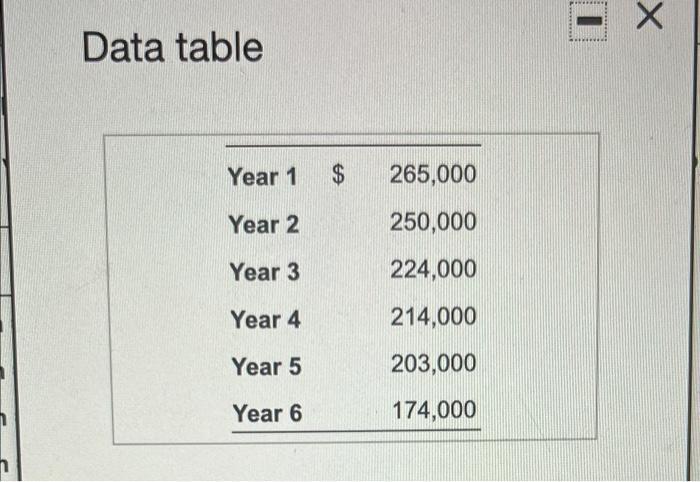
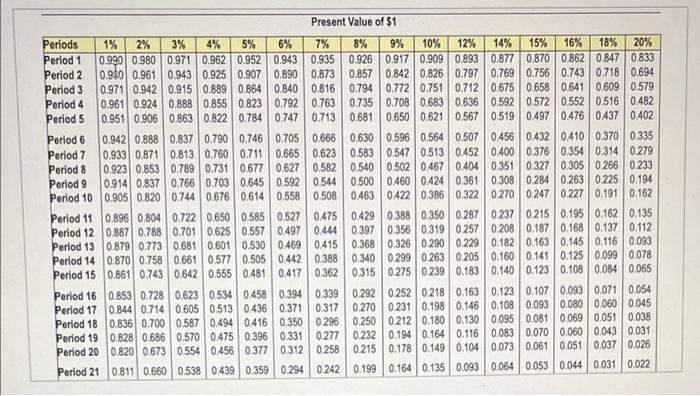
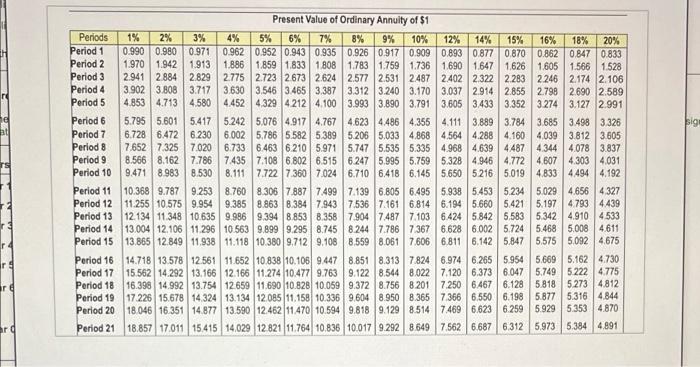
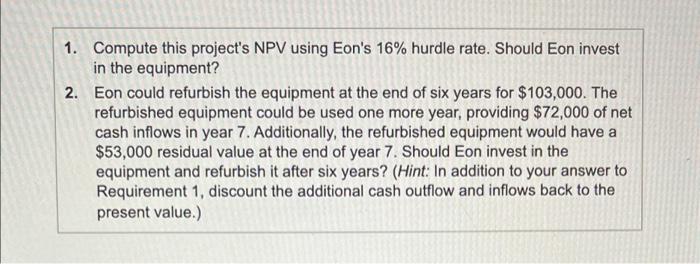
g Eon Industries is deciding whether to automate one phase of its production process. The manufacturing equipment has a six-year life and will cost $925,000. Projected net cash inflows are as follows: (Click the icon to view the projected net cash inflows.) (Click the icon to view Present Value of $1 table.) Read the requirements Requirement 1. Compute this project's NPV using Eon's 16 % hurdle rate. Should Eon invest in the equipment? Use the following table to calculate the net present value of the project. (Enter any factor amounts to three decimal places, XXXX Use parentheses or a minus sign for a negative net present value.) Years Year 1 Year 2 Year 3 Year 4 Year 5 Present value of each year's inflow: (n = 1) Present value of each year's inflow: (n=2) Present value of each year's inflow: (n = 3) Present value of each year's inflow: (n = 4) Present value of each year's inflow: (n = 5) Year 6 Present value of each year's inflow: (n = 6) Total PV of cash inflows Year 0 Initial investment (Click the icon to view Present Value of Ordinary Annuity of $1 table.) Net present value of the project Net Cash Inflow $ 265,000 250,000 224,000 214,000 203,000 174,000 PV Factor ( = 16%) 0.862 $ 0.743 0.641 0.552 0.476 0.410 Present Value 228,430 185,750 143,584 118,128 96,628 71,340 Data table Year 1 $ Year 2 Year 3 Year 4 Year 5 Year 6 265,000 250,000 224,000 214,000 203,000 174,000 X Periods Period 1 Period 2 Period 3 Period 4 Period 5 Period 6 Period 7 Period 8 Period 9 Period 10 Period 11 Period 12 Period 13 Period 14 Period 15 Period 16 Period 17 Period 18 Period 19 Period 20 Present Value of $1 1% 2% 3% 5% 4% 6% 7% 8% 9% 10% 12% 14% 15% 16% 18% 20% 0.990 0.980 0.971 0.962 0.952 0.943 0.935 0.926 0.917 0.909 0.893 0.877 0.870 0.862 0.847 0.833 0.980 0.961 0.943 0.925 0.907 0.890 0.873 0.857 0.842 0.826 0.797 0.769 0.756 0.743 0.718 0.694 0.971 0.942 0.915 0.889 0.864 0.840 0.816 0.794 0.772 0.751 0.712 0.658 0.641 0.609 0.579 0.961 0.924 0.888 0.855 0.823 0.792 0.763 0.572 0.552 0.516 0.482 0.951 0.906 0.863 0.822 0.784 0.747 0.713 0.681 0.650 0.621 0.567 0.519 0.497 0.476 0.437 0.402 0.675 0.735 0.708 0.683 0.636 0.592 0.790 0.746 0.705 0.666 0.665 0.623 0.627 0.582 0.760 0.711 0.731 0.677 0.766 0.703 0.645 0.592 0.544 0.942 0.888 0.837 0.813 0.933 0.871 0.923 0.853 0.789 0.914 0.837 0.905 0.820 0.744 0.676 0.614 0.630 0.596 0.564 0.507 0.583 0.547 0.513 0.452 0.540 0.502 0.467 0.404 0.500 0.460 0424 0.361 0.558 0.508 0.463 0.429 0.388 0.350 0.287 0.397 0.356 0.319 0.257 0.208 0.368 0.326 0.290 0.229 0.182 0.340 0.299 0.263 0.205 0.160 0.315 0.896 0.804 0.722 0.650 0.585 0.527 0475 0.887 0.788 0.701 0.625 0.557 0.497 0.444 0.879 0.773 0.681 0.601 0.530 0.469 0.415 0.870 0.758 0.661 0.577 0.505 0.442 0.388 0.642 0.555 0.481 0.417 0.362 0.861 0.743 0.853 0.728 0.844 0.714 0.836 0.700 0.587 0.494 0.416 0.828 0.686 0.570 0.475 0.396 0.673 0.554 0.456 0.377 0.439 0.359 0.294 0242 0.623 0.534 0.458 0.394 0.339 0.605 0.513 0.436 0.371 0.317 0.350 0.296 0.331 0.277 0.312 0.258 0.820 Period 21 0.811 0.660 0.538 0.456 0.432 0410 0.370 0.335 0.400 0.376 0.354 0.314 0.279 0.351 0.327 0.305 0.266 0.233 0.308 0.284 0.263 0.225 0.194 0.422 0.386 0.322 0.270 0.247 0.227 0.191 0.162 0.237 0.215 0.195 0.162 0.135 0.187 0.168 0.137 0.112 0.163 0.145 0.116 0.093 0.141 0.125 0.099 0.078 0.275 0.239 0.183 0.140 0.123 0.108 0.084 0.065 0.292 0.252 0.218 0.163 0.123 0.107 0.093 0.071 0.054 0.270 0.231 0.198 0.146 0.108 0.093 0.080 0.060 0.045 0.250 0.212 0.180 0.130 0.095 0.081 0.069 0.051 0.038 0.232 0.194 0.164 0.116 0.083 0.070 0.060 0.043 0.031 0.215 0.178 0.149 0.104 0.073 0.061 0.051 0.037 0.026 0.199 0.164 0.135 0.093 0.064 0.053 0.044 0.031 0.022 ré ar q Periods 1% 2% Period 1 Period 2 Period 3 Period 4 Period 5 Period 6 Period 7 Period 8 Period 9 Period 10 Period 11 Period 12 Period 13 Period 14 Period 15 Period 16 Period 17 Period 18 Period 19 Period 20 Period 21 3% 0.990 0.980 0.971 1.970 1.942 1.913 2.941 2.884 2.829 3.902 3.808 3.717 4.853 4.713 4.580 Present Value of Ordinary Annuity of $1 4% 8% 9% 10% 16% 18% 20% 5% 6% 7% 12% 14% 15% 0.962 0.952 0.943 0.935 0.926 0.917 0.909 0.893 0.877 0.870 0.862 0.847 0.833 1.859 1.833 1.808 1.783 1.759 1.736 1.690 1.647 1.626 1.605 1.566 1.528 2.723 2.673 2.577 2.531 2.487 2.402 2.322 2.283 2.246 2.174 2.106 3.312 3.240 3.170 3.037 2.914 2.855 2.798 2.690 2.589 1.886 2.775 3.630 3.546 3.465 4.329 4.212 2.624 3.387 4.100 4.452 3.993 3.890 3.791 3.605 3.433 3.352 3.274 3.127 2.991 5,076 4.917 4.767 5,786 5.582 5.389 5.795 5.601 5.417 5.242 6.728 6.472 6.230 6.002 7.652 7.325 7.020 6.733 6.463 6.210 5.971 8.566 8.162 7.786 7.435 7.108 6.802 6.515 9.471 8.983 8.530 8.111 7.722 7.360 7.024 10.368 9.787 9.253 8.760 8.306 7.887 7.499 11.255 10.575 9.954 9.385 8.863 8.384 7.943 12.134 11.348 10.635 9.986 9.394 8.853 8.358 13.004 12.106 11.296 10.563 9.899 9.295 8.745 13.865 12.849 11.938 11.118 10.380 9.712 9.108 4.623 4.486 4.355 3.685 3.498 3.326 4.111 3.889 3.784 5.206 5.033 4.868 4.564 4.288 4.160 4.039 3.812 3.605 5.747 5.535 5.335 4.968 4.639 4487 4.344 4.078 3.837 6.247 5.995 5.759 5.328 4.946 4.772 4.607 4.303 4.031 6.710 6.418 6.145 5.650 5.216 5.019 4.833 4.494 4.192 7.139 6.805 6.495 5.938 5.453 5.234 7.536 7.161 6.814 6.194 5.660 5.421 7.904 7.487 7.103 6.424 5.842 5.583 8.244 7.786 7.367 6.628 6.002 5.724 8.559 8.061 7.606 6.811 6.142 5.847 14.718 13.578 12.561 11.652 10.838 10.106 9.447 8.851 8.313 7.824 6.974 6.265 5.954 15.562 14.292 13.166 12.166 11.274 10.477 9.763 9.122 8.544 8.022 7.120 6.373 6.047 16.398 14.992 13.754 12.659 11.690 10.828 10.059 9.372 8.756 8.201 7.250 6.467 6.128 5.818 5.273 4.812 17.226 15.678 14.324 13.134 12.085 11.158 10.336 9.604 8.950 8.365 7.366 6.550 6.198 5.877 5.316 4.844 18.046 16.351 14.877 13.590 12.462 11.470 10.594 9.818 9.129 8.514 7.469 6.623 6.259 5.929 5.353 4.870 7.562 6.687 6.312 5.973 5.384 4.891 5.029 4.656 4.327 5.197 4.793 4.439 5.342 4.910 4.533 5.468 5.008 4.611 5.575 5.092 4.675 5.669 5.162 4.730 5.749 5.222 4.775 18.857 17.011 15.415 14.029 12.821 11.764 10.836 10.017 9.292 8.649 sign 1. Compute this project's NPV using Eon's 16% hurdle rate. Should Eon invest in the equipment? 2. Eon could refurbish the equipment at the end of six years for $103,000. The refurbished equipment could be used one more year, providing $72,000 of net cash inflows in year 7. Additionally, the refurbished equipment would have a $53,000 residual value at the end of year 7. Should Eon invest in the equipment and refurbish it after six years? (Hint: In addition to your answer to Requirement 1, discount the additional cash outflow and inflows back to the present value.) g Eon Industries is deciding whether to automate one phase of its production process. The manufacturing equipment has a six-year life and will cost $925,000. Projected net cash inflows are as follows: (Click the icon to view the projected net cash inflows.) (Click the icon to view Present Value of $1 table.) Read the requirements Requirement 1. Compute this project's NPV using Eon's 16 % hurdle rate. Should Eon invest in the equipment? Use the following table to calculate the net present value of the project. (Enter any factor amounts to three decimal places, XXXX Use parentheses or a minus sign for a negative net present value.) Years Year 1 Year 2 Year 3 Year 4 Year 5 Present value of each year's inflow: (n = 1) Present value of each year's inflow: (n=2) Present value of each year's inflow: (n = 3) Present value of each year's inflow: (n = 4) Present value of each year's inflow: (n = 5) Year 6 Present value of each year's inflow: (n = 6) Total PV of cash inflows Year 0 Initial investment (Click the icon to view Present Value of Ordinary Annuity of $1 table.) Net present value of the project Net Cash Inflow $ 265,000 250,000 224,000 214,000 203,000 174,000 PV Factor ( = 16%) 0.862 $ 0.743 0.641 0.552 0.476 0.410 Present Value 228,430 185,750 143,584 118,128 96,628 71,340 Data table Year 1 $ Year 2 Year 3 Year 4 Year 5 Year 6 265,000 250,000 224,000 214,000 203,000 174,000 X Periods Period 1 Period 2 Period 3 Period 4 Period 5 Period 6 Period 7 Period 8 Period 9 Period 10 Period 11 Period 12 Period 13 Period 14 Period 15 Period 16 Period 17 Period 18 Period 19 Period 20 Present Value of $1 1% 2% 3% 5% 4% 6% 7% 8% 9% 10% 12% 14% 15% 16% 18% 20% 0.990 0.980 0.971 0.962 0.952 0.943 0.935 0.926 0.917 0.909 0.893 0.877 0.870 0.862 0.847 0.833 0.980 0.961 0.943 0.925 0.907 0.890 0.873 0.857 0.842 0.826 0.797 0.769 0.756 0.743 0.718 0.694 0.971 0.942 0.915 0.889 0.864 0.840 0.816 0.794 0.772 0.751 0.712 0.658 0.641 0.609 0.579 0.961 0.924 0.888 0.855 0.823 0.792 0.763 0.572 0.552 0.516 0.482 0.951 0.906 0.863 0.822 0.784 0.747 0.713 0.681 0.650 0.621 0.567 0.519 0.497 0.476 0.437 0.402 0.675 0.735 0.708 0.683 0.636 0.592 0.760 0.711 0.790 0.746 0.705 0.666 0.665 0.623 0.627 0.582 0.731 0.677 0.766 0.703 0.645 0.592 0.544 0.942 0.888 0.837 0.813 0.933 0.871 0.923 0.853 0.789 0.914 0.837 0.905 0.820 0.744 0.676 0.614 0.630 0.596 0.564 0.507 0.583 0.547 0.513 0.452 0.540 0.502 0.467 0.404 0.500 0.460 0424 0.361 0.558 0.508 0.463 0.429 0.388 0.350 0.287 0.397 0.356 0.319 0.257 0.208 0.368 0.326 0.290 0.229 0.182 0.340 0.299 0.263 0.205 0.160 0.315 0.896 0.804 0.722 0.650 0.585 0.527 0475 0.887 0.788 0.701 0.625 0.557 0.497 0.444 0.879 0.773 0.681 0.601 0.530 0.469 0.415 0.870 0.758 0.661 0.577 0.505 0.442 0.388 0.642 0.555 0.481 0.417 0.362 0.861 0.743 0.853 0.728 0.844 0.714 0.836 0.700 0.587 0.494 0.416 0.828 0.686 0.570 0.475 0.396 0.673 0.554 0.456 0.377 0.439 0.359 0.294 0242 0.623 0.534 0.458 0.394 0.339 0.605 0.513 0.436 0.371 0.317 0.350 0.296 0.331 0.277 0.312 0.258 0.820 Period 21 0.811 0.660 0.538 0.456 0.432 0410 0.370 0.335 0.400 0.376 0.354 0.314 0.279 0.351 0.327 0.305 0.266 0.233 0.308 0.284 0.263 0.225 0.194 0.422 0.386 0.322 0.270 0.247 0.227 0.191 0.162 0.237 0.215 0.195 0.162 0.135 0.187 0.168 0.137 0.112 0.163 0.145 0.116 0.093 0.141 0.125 0.099 0.078 0.275 0.239 0.183 0.140 0.123 0.108 0.084 0.065 0.292 0.252 0.218 0.163 0.123 0.107 0.093 0.071 0.054 0.270 0.231 0.198 0.146 0.108 0.093 0.080 0.060 0.045 0.250 0.212 0.180 0.130 0.095 0.081 0.069 0.051 0.038 0.232 0.194 0.164 0.116 0.083 0.070 0.060 0.043 0.031 0.215 0.178 0.149 0.104 0.073 0.061 0.051 0.037 0.026 0.199 0.164 0.135 0.093 0.064 0.053 0.044 0.031 0.022 ré ar q Periods 1% 2% Period 1 Period 2 Period 3 Period 4 Period 5 Period 6 Period 7 Period 8 Period 9 Period 10 Period 11 Period 12 Period 13 Period 14 Period 15 Period 16 Period 17 Period 18 Period 19 Period 20 Period 21 3% 0.990 0.980 0.971 1.970 1.942 1.913 2.941 2.884 2.829 3.902 3.808 3.717 4.853 4.713 4.580 Present Value of Ordinary Annuity of $1 4% 8% 9% 10% 16% 18% 20% 5% 6% 7% 12% 14% 15% 0.962 0.952 0.943 0.935 0.926 0.917 0.909 0.893 0.877 0.870 0.862 0.847 0.833 1.859 1.833 1.808 1.783 1.759 1.736 1.690 1.647 1.626 1.605 1.566 1.528 2.723 2.673 2.577 2.531 2.487 2.402 2.322 2.283 2.246 2.174 2.106 3.312 3.240 3.170 3.037 2.914 2.855 2.798 2.690 2.589 1.886 2.775 3.630 3.546 3.465 4.329 4.212 2.624 3.387 4.100 4.452 3.993 3.890 3.791 3.605 3.433 3.352 3.274 3.127 2.991 5,076 4.917 4.767 5,786 5.582 5.389 5.795 5.601 5.417 5.242 6.728 6.472 6.230 6.002 7.652 7.325 7.020 6.733 6.463 6.210 5.971 8.566 8.162 7.786 7.435 7.108 6.802 6.515 9.471 8.983 8.530 8.111 7.722 7.360 7.024 10.368 9.787 9.253 8.760 8.306 7.887 7.499 11.255 10.575 9.954 9.385 8.863 8.384 7.943 12.134 11.348 10.635 9.986 9.394 8.853 8.358 13.004 12.106 11.296 10.563 9.899 9.295 8.745 13.865 12.849 11.938 11.118 10.380 9.712 9.108 4.623 4.486 4.355 3.685 3.498 3.326 4.111 3.889 3.784 5.206 5.033 4.868 4.564 4.288 4.160 4.039 3.812 3.605 5.747 5.535 5.335 4.968 4.639 4487 4.344 4.078 3.837 6.247 5.995 5.759 5.328 4.946 4.772 4.607 4.303 4.031 6.710 6.418 6.145 5.650 5.216 5.019 4.833 4.494 4.192 7.139 6.805 6.495 5.938 5.453 5.234 7.536 7.161 6.814 6.194 5.660 5.421 7.904 7.487 7.103 6.424 5.842 5.583 8.244 7.786 7.367 6.628 6.002 5.724 8.559 8.061 7.606 6.811 6.142 5.847 14.718 13.578 12.561 11.652 10.838 10.106 9.447 8.851 8.313 7.824 6.974 6.265 5.954 15.562 14.292 13.166 12.166 11.274 10.477 9.763 9.122 8.544 8.022 7.120 6.373 6.047 16.398 14.992 13.754 12.659 11.690 10.828 10.059 9.372 8.756 8.201 7.250 6.467 6.128 5.818 5.273 4.812 17.226 15.678 14.324 13.134 12.085 11.158 10.336 9.604 8.950 8.365 7.366 6.550 6.198 5.877 5.316 4.844 18.046 16.351 14.877 13.590 12.462 11.470 10.594 9.818 9.129 8.514 7.469 6.623 6.259 5.929 5.353 4.870 7.562 6.687 6.312 5.973 5.384 4.891 5.029 4.656 4.327 5.197 4.793 4.439 5.342 4.910 4.533 5.468 5.008 4.611 5.575 5.092 4.675 5.669 5.162 4.730 5.749 5.222 4.775 18.857 17.011 15.415 14.029 12.821 11.764 10.836 10.017 9.292 8.649 sign 1. Compute this project's NPV using Eon's 16% hurdle rate. Should Eon invest in the equipment? 2. Eon could refurbish the equipment at the end of six years for $103,000. The refurbished equipment could be used one more year, providing $72,000 of net cash inflows in year 7. Additionally, the refurbished equipment would have a $53,000 residual value at the end of year 7. Should Eon invest in the equipment and refurbish it after six years? (Hint: In addition to your answer to Requirement 1, discount the additional cash outflow and inflows back to the present value.) g Eon Industries is deciding whether to automate one phase of its production process. The manufacturing equipment has a six-year life and will cost $925,000. Projected net cash inflows are as follows: (Click the icon to view the projected net cash inflows.) (Click the icon to view Present Value of $1 table.) Read the requirements Requirement 1. Compute this project's NPV using Eon's 16 % hurdle rate. Should Eon invest in the equipment? Use the following table to calculate the net present value of the project. (Enter any factor amounts to three decimal places, XXXX Use parentheses or a minus sign for a negative net present value.) Years Year 1 Year 2 Year 3 Year 4 Year 5 Present value of each year's inflow: (n = 1) Present value of each year's inflow: (n=2) Present value of each year's inflow: (n = 3) Present value of each year's inflow: (n = 4) Present value of each year's inflow: (n = 5) Year 6 Present value of each year's inflow: (n = 6) Total PV of cash inflows Year 0 Initial investment (Click the icon to view Present Value of Ordinary Annuity of $1 table.) Net present value of the project Net Cash Inflow $ 265,000 250,000 224,000 214,000 203,000 174,000 PV Factor ( = 16%) 0.862 $ 0.743 0.641 0.552 0.476 0.410 Present Value 228,430 185,750 143,584 118,128 96,628 71,340 Data table Year 1 $ Year 2 Year 3 Year 4 Year 5 Year 6 265,000 250,000 224,000 214,000 203,000 174,000 X Periods Period 1 Period 2 Period 3 Period 4 Period 5 Period 6 Period 7 Period 8 Period 9 Period 10 Period 11 Period 12 Period 13 Period 14 Period 15 Period 16 Period 17 Period 18 Period 19 Period 20 Present Value of $1 1% 2% 3% 5% 4% 6% 7% 8% 9% 10% 12% 14% 15% 16% 18% 20% 0.990 0.980 0.971 0.962 0.952 0.943 0.935 0.926 0.917 0.909 0.893 0.877 0.870 0.862 0.847 0.833 0.980 0.961 0.943 0.925 0.907 0.890 0.873 0.857 0.842 0.826 0.797 0.769 0.756 0.743 0.718 0.694 0.971 0.942 0.915 0.889 0.864 0.840 0.816 0.794 0.772 0.751 0.712 0.658 0.641 0.609 0.579 0.961 0.924 0.888 0.855 0.823 0.792 0.763 0.572 0.552 0.516 0.482 0.951 0.906 0.863 0.822 0.784 0.747 0.713 0.681 0.650 0.621 0.567 0.519 0.497 0.476 0.437 0.402 0.675 0.735 0.708 0.683 0.636 0.592 0.790 0.746 0.705 0.666 0.665 0.623 0.627 0.582 0.760 0.711 0.731 0.677 0.766 0.703 0.645 0.592 0.544 0.942 0.888 0.837 0.813 0.933 0.871 0.923 0.853 0.789 0.914 0.837 0.905 0.820 0.744 0.676 0.614 0.630 0.596 0.564 0.507 0.583 0.547 0.513 0.452 0.540 0.502 0.467 0.404 0.500 0.460 0424 0.361 0.558 0.508 0.463 0.429 0.388 0.350 0.287 0.397 0.356 0.319 0.257 0.208 0.368 0.326 0.290 0.229 0.182 0.340 0.299 0.263 0.205 0.160 0.315 0.896 0.804 0.722 0.650 0.585 0.527 0475 0.887 0.788 0.701 0.625 0.557 0.497 0.444 0.879 0.773 0.681 0.601 0.530 0.469 0.415 0.870 0.758 0.661 0.577 0.505 0.442 0.388 0.642 0.555 0.481 0.417 0.362 0.861 0.743 0.853 0.728 0.844 0.714 0.836 0.700 0.587 0.494 0.416 0.828 0.686 0.570 0.475 0.396 0.673 0.554 0.456 0.377 0.439 0.359 0.294 0242 0.623 0.534 0.458 0.394 0.339 0.605 0.513 0.436 0.371 0.317 0.350 0.296 0.331 0.277 0.312 0.258 0.820 Period 21 0.811 0.660 0.538 0.456 0.432 0410 0.370 0.335 0.400 0.376 0.354 0.314 0.279 0.351 0.327 0.305 0.266 0.233 0.308 0.284 0.263 0.225 0.194 0.422 0.386 0.322 0.270 0.247 0.227 0.191 0.162 0.237 0.215 0.195 0.162 0.135 0.187 0.168 0.137 0.112 0.163 0.145 0.116 0.093 0.141 0.125 0.099 0.078 0.275 0.239 0.183 0.140 0.123 0.108 0.084 0.065 0.292 0.252 0.218 0.163 0.123 0.107 0.093 0.071 0.054 0.270 0.231 0.198 0.146 0.108 0.093 0.080 0.060 0.045 0.250 0.212 0.180 0.130 0.095 0.081 0.069 0.051 0.038 0.232 0.194 0.164 0.116 0.083 0.070 0.060 0.043 0.031 0.215 0.178 0.149 0.104 0.073 0.061 0.051 0.037 0.026 0.199 0.164 0.135 0.093 0.064 0.053 0.044 0.031 0.022 ré ar q Periods 1% 2% Period 1 Period 2 Period 3 Period 4 Period 5 Period 6 Period 7 Period 8 Period 9 Period 10 Period 11 Period 12 Period 13 Period 14 Period 15 Period 16 Period 17 Period 18 Period 19 Period 20 Period 21 3% 0.990 0.980 0.971 1.970 1.942 1.913 2.941 2.884 2.829 3.902 3.808 3.717 4.853 4.713 4.580 Present Value of Ordinary Annuity of $1 4% 8% 9% 10% 16% 18% 20% 5% 6% 7% 12% 14% 15% 0.962 0.952 0.943 0.935 0.926 0.917 0.909 0.893 0.877 0.870 0.862 0.847 0.833 1.859 1.833 1.808 1.783 1.759 1.736 1.690 1.647 1.626 1.605 1.566 1.528 2.723 2.673 2.577 2.531 2.487 2.402 2.322 2.283 2.246 2.174 2.106 3.312 3.240 3.170 3.037 2.914 2.855 2.798 2.690 2.589 1.886 2.775 3.630 3.546 3.465 4.329 4.212 2.624 3.387 4.100 4.452 3.993 3.890 3.791 3.605 3.433 3.352 3.274 3.127 2.991 5,076 4.917 4.767 5,786 5.582 5.389 5.795 5.601 5.417 5.242 6.728 6.472 6.230 6.002 7.652 7.325 7.020 6.733 6.463 6.210 5.971 8.566 8.162 7.786 7.435 7.108 6.802 6.515 9.471 8.983 8.530 8.111 7.722 7.360 7.024 10.368 9.787 9.253 8.760 8.306 7.887 7.499 11.255 10.575 9.954 9.385 8.863 8.384 7.943 12.134 11.348 10.635 9.986 9.394 8.853 8.358 13.004 12.106 11.296 10.563 9.899 9.295 8.745 13.865 12.849 11.938 11.118 10.380 9.712 9.108 4.623 4.486 4.355 3.685 3.498 3.326 4.111 3.889 3.784 5.206 5.033 4.868 4.564 4.288 4.160 4.039 3.812 3.605 5.747 5.535 5.335 4.968 4.639 4487 4.344 4.078 3.837 6.247 5.995 5.759 5.328 4.946 4.772 4.607 4.303 4.031 6.710 6.418 6.145 5.650 5.216 5.019 4.833 4.494 4.192 7.139 6.805 6.495 5.938 5.453 5.234 7.536 7.161 6.814 6.194 5.660 5.421 7.904 7.487 7.103 6.424 5.842 5.583 8.244 7.786 7.367 6.628 6.002 5.724 8.559 8.061 7.606 6.811 6.142 5.847 14.718 13.578 12.561 11.652 10.838 10.106 9.447 8.851 8.313 7.824 6.974 6.265 5.954 15.562 14.292 13.166 12.166 11.274 10.477 9.763 9.122 8.544 8.022 7.120 6.373 6.047 16.398 14.992 13.754 12.659 11.690 10.828 10.059 9.372 8.756 8.201 7.250 6.467 6.128 5.818 5.273 4.812 17.226 15.678 14.324 13.134 12.085 11.158 10.336 9.604 8.950 8.365 7.366 6.550 6.198 5.877 5.316 4.844 18.046 16.351 14.877 13.590 12.462 11.470 10.594 9.818 9.129 8.514 7.469 6.623 6.259 5.929 5.353 4.870 7.562 6.687 6.312 5.973 5.384 4.891 5.029 4.656 4.327 5.197 4.793 4.439 5.342 4.910 4.533 5.468 5.008 4.611 5.575 5.092 4.675 5.669 5.162 4.730 5.749 5.222 4.775 18.857 17.011 15.415 14.029 12.821 11.764 10.836 10.017 9.292 8.649 sign 1. Compute this project's NPV using Eon's 16% hurdle rate. Should Eon invest in the equipment? 2. Eon could refurbish the equipment at the end of six years for $103,000. The refurbished equipment could be used one more year, providing $72,000 of net cash inflows in year 7. Additionally, the refurbished equipment would have a $53,000 residual value at the end of year 7. Should Eon invest in the equipment and refurbish it after six years? (Hint: In addition to your answer to Requirement 1, discount the additional cash outflow and inflows back to the present value.) g Eon Industries is deciding whether to automate one phase of its production process. The manufacturing equipment has a six-year life and will cost $925,000. Projected net cash inflows are as follows: (Click the icon to view the projected net cash inflows.) (Click the icon to view Present Value of $1 table.) Read the requirements Requirement 1. Compute this project's NPV using Eon's 16 % hurdle rate. Should Eon invest in the equipment? Use the following table to calculate the net present value of the project. (Enter any factor amounts to three decimal places, XXXX Use parentheses or a minus sign for a negative net present value.) Years Year 1 Year 2 Year 3 Year 4 Year 5 Present value of each year's inflow: (n = 1) Present value of each year's inflow: (n=2) Present value of each year's inflow: (n = 3) Present value of each year's inflow: (n = 4) Present value of each year's inflow: (n = 5) Year 6 Present value of each year's inflow: (n = 6) Total PV of cash inflows Year 0 Initial investment (Click the icon to view Present Value of Ordinary Annuity of $1 table.) Net present value of the project Net Cash Inflow $ 265,000 250,000 224,000 214,000 203,000 174,000 PV Factor ( = 16%) 0.862 $ 0.743 0.641 0.552 0.476 0.410 Present Value 228,430 185,750 143,584 118,128 96,628 71,340 Data table Year 1 $ Year 2 Year 3 Year 4 Year 5 Year 6 265,000 250,000 224,000 214,000 203,000 174,000 X Periods Period 1 Period 2 Period 3 Period 4 Period 5 Period 6 Period 7 Period 8 Period 9 Period 10 Period 11 Period 12 Period 13 Period 14 Period 15 Period 16 Period 17 Period 18 Period 19 Period 20 Present Value of $1 1% 2% 3% 5% 4% 6% 7% 8% 9% 10% 12% 14% 15% 16% 18% 20% 0.990 0.980 0.971 0.962 0.952 0.943 0.935 0.926 0.917 0.909 0.893 0.877 0.870 0.862 0.847 0.833 0.980 0.961 0.943 0.925 0.907 0.890 0.873 0.857 0.842 0.826 0.797 0.769 0.756 0.743 0.718 0.694 0.971 0.942 0.915 0.889 0.864 0.840 0.816 0.794 0.772 0.751 0.712 0.658 0.641 0.609 0.579 0.961 0.924 0.888 0.855 0.823 0.792 0.763 0.572 0.552 0.516 0.482 0.951 0.906 0.863 0.822 0.784 0.747 0.713 0.681 0.650 0.621 0.567 0.519 0.497 0.476 0.437 0.402 0.675 0.735 0.708 0.683 0.636 0.592 0.790 0.746 0.705 0.666 0.665 0.623 0.627 0.582 0.760 0.711 0.731 0.677 0.766 0.703 0.645 0.592 0.544 0.942 0.888 0.837 0.813 0.933 0.871 0.923 0.853 0.789 0.914 0.837 0.905 0.820 0.744 0.676 0.614 0.630 0.596 0.564 0.507 0.583 0.547 0.513 0.452 0.540 0.502 0.467 0.404 0.500 0.460 0424 0.361 0.558 0.508 0.463 0.429 0.388 0.350 0.287 0.397 0.356 0.319 0.257 0.208 0.368 0.326 0.290 0.229 0.182 0.340 0.299 0.263 0.205 0.160 0.315 0.896 0.804 0.722 0.650 0.585 0.527 0475 0.887 0.788 0.701 0.625 0.557 0.497 0.444 0.879 0.773 0.681 0.601 0.530 0.469 0.415 0.870 0.758 0.661 0.577 0.505 0.442 0.388 0.642 0.555 0.481 0.417 0.362 0.861 0.743 0.853 0.728 0.844 0.714 0.836 0.700 0.587 0.494 0.416 0.828 0.686 0.570 0.475 0.396 0.673 0.554 0.456 0.377 0.439 0.359 0.294 0242 0.623 0.534 0.458 0.394 0.339 0.605 0.513 0.436 0.371 0.317 0.350 0.296 0.331 0.277 0.312 0.258 0.820 Period 21 0.811 0.660 0.538 0.456 0.432 0410 0.370 0.335 0.400 0.376 0.354 0.314 0.279 0.351 0.327 0.305 0.266 0.233 0.308 0.284 0.263 0.225 0.194 0.422 0.386 0.322 0.270 0.247 0.227 0.191 0.162 0.237 0.215 0.195 0.162 0.135 0.187 0.168 0.137 0.112 0.163 0.145 0.116 0.093 0.141 0.125 0.099 0.078 0.275 0.239 0.183 0.140 0.123 0.108 0.084 0.065 0.292 0.252 0.218 0.163 0.123 0.107 0.093 0.071 0.054 0.270 0.231 0.198 0.146 0.108 0.093 0.080 0.060 0.045 0.250 0.212 0.180 0.130 0.095 0.081 0.069 0.051 0.038 0.232 0.194 0.164 0.116 0.083 0.070 0.060 0.043 0.031 0.215 0.178 0.149 0.104 0.073 0.061 0.051 0.037 0.026 0.199 0.164 0.135 0.093 0.064 0.053 0.044 0.031 0.022 ré ar q Periods 1% 2% Period 1 Period 2 Period 3 Period 4 Period 5 Period 6 Period 7 Period 8 Period 9 Period 10 Period 11 Period 12 Period 13 Period 14 Period 15 Period 16 Period 17 Period 18 Period 19 Period 20 Period 21 3% 0.990 0.980 0.971 1.970 1.942 1.913 2.941 2.884 2.829 3.902 3.808 3.717 4.853 4.713 4.580 Present Value of Ordinary Annuity of $1 4% 8% 9% 10% 16% 18% 20% 5% 6% 7% 12% 14% 15% 0.962 0.952 0.943 0.935 0.926 0.917 0.909 0.893 0.877 0.870 0.862 0.847 0.833 1.859 1.833 1.808 1.783 1.759 1.736 1.690 1.647 1.626 1.605 1.566 1.528 2.723 2.673 2.577 2.531 2.487 2.402 2.322 2.283 2.246 2.174 2.106 3.312 3.240 3.170 3.037 2.914 2.855 2.798 2.690 2.589 1.886 2.775 3.630 3.546 3.465 4.329 4.212 2.624 3.387 4.100 4.452 3.993 3.890 3.791 3.605 3.433 3.352 3.274 3.127 2.991 5,076 4.917 4.767 5,786 5.582 5.389 5.795 5.601 5.417 5.242 6.728 6.472 6.230 6.002 7.652 7.325 7.020 6.733 6.463 6.210 5.971 8.566 8.162 7.786 7.435 7.108 6.802 6.515 9.471 8.983 8.530 8.111 7.722 7.360 7.024 10.368 9.787 9.253 8.760 8.306 7.887 7.499 11.255 10.575 9.954 9.385 8.863 8.384 7.943 12.134 11.348 10.635 9.986 9.394 8.853 8.358 13.004 12.106 11.296 10.563 9.899 9.295 8.745 13.865 12.849 11.938 11.118 10.380 9.712 9.108 4.623 4.486 4.355 3.685 3.498 3.326 4.111 3.889 3.784 5.206 5.033 4.868 4.564 4.288 4.160 4.039 3.812 3.605 5.747 5.535 5.335 4.968 4.639 4487 4.344 4.078 3.837 6.247 5.995 5.759 5.328 4.946 4.772 4.607 4.303 4.031 6.710 6.418 6.145 5.650 5.216 5.019 4.833 4.494 4.192 7.139 6.805 6.495 5.938 5.453 5.234 7.536 7.161 6.814 6.194 5.660 5.421 7.904 7.487 7.103 6.424 5.842 5.583 8.244 7.786 7.367 6.628 6.002 5.724 8.559 8.061 7.606 6.811 6.142 5.847 14.718 13.578 12.561 11.652 10.838 10.106 9.447 8.851 8.313 7.824 6.974 6.265 5.954 15.562 14.292 13.166 12.166 11.274 10.477 9.763 9.122 8.544 8.022 7.120 6.373 6.047 16.398 14.992 13.754 12.659 11.690 10.828 10.059 9.372 8.756 8.201 7.250 6.467 6.128 5.818 5.273 4.812 17.226 15.678 14.324 13.134 12.085 11.158 10.336 9.604 8.950 8.365 7.366 6.550 6.198 5.877 5.316 4.844 18.046 16.351 14.877 13.590 12.462 11.470 10.594 9.818 9.129 8.514 7.469 6.623 6.259 5.929 5.353 4.870 7.562 6.687 6.312 5.973 5.384 4.891 5.029 4.656 4.327 5.197 4.793 4.439 5.342 4.910 4.533 5.468 5.008 4.611 5.575 5.092 4.675 5.669 5.162 4.730 5.749 5.222 4.775 18.857 17.011 15.415 14.029 12.821 11.764 10.836 10.017 9.292 8.649 sign 1. Compute this project's NPV using Eon's 16% hurdle rate. Should Eon invest in the equipment? 2. Eon could refurbish the equipment at the end of six years for $103,000. The refurbished equipment could be used one more year, providing $72,000 of net cash inflows in year 7. Additionally, the refurbished equipment would have a $53,000 residual value at the end of year 7. Should Eon invest in the equipment and refurbish it after six years? (Hint: In addition to your answer to Requirement 1, discount the additional cash outflow and inflows back to the present value.) g Eon Industries is deciding whether to automate one phase of its production process. The manufacturing equipment has a six-year life and will cost $925,000. Projected net cash inflows are as follows: (Click the icon to view the projected net cash inflows.) (Click the icon to view Present Value of $1 table.) Read the requirements Requirement 1. Compute this project's NPV using Eon's 16 % hurdle rate. Should Eon invest in the equipment? Use the following table to calculate the net present value of the project. (Enter any factor amounts to three decimal places, XXXX Use parentheses or a minus sign for a negative net present value.) Years Year 1 Year 2 Year 3 Year 4 Year 5 Present value of each year's inflow: (n = 1) Present value of each year's inflow: (n=2) Present value of each year's inflow: (n = 3) Present value of each year's inflow: (n = 4) Present value of each year's inflow: (n = 5) Year 6 Present value of each year's inflow: (n = 6) Total PV of cash inflows Year 0 Initial investment (Click the icon to view Present Value of Ordinary Annuity of $1 table.) Net present value of the project Net Cash Inflow $ 265,000 250,000 224,000 214,000 203,000 174,000 PV Factor ( = 16%) 0.862 $ 0.743 0.641 0.552 0.476 0.410 Present Value 228,430 185,750 143,584 118,128 96,628 71,340 Data table Year 1 $ Year 2 Year 3 Year 4 Year 5 Year 6 265,000 250,000 224,000 214,000 203,000 174,000 X Periods Period 1 Period 2 Period 3 Period 4 Period 5 Period 6 Period 7 Period 8 Period 9 Period 10 Period 11 Period 12 Period 13 Period 14 Period 15 Period 16 Period 17 Period 18 Period 19 Period 20 Present Value of $1 1% 2% 3% 5% 4% 6% 7% 8% 9% 10% 12% 14% 15% 16% 18% 20% 0.990 0.980 0.971 0.962 0.952 0.943 0.935 0.926 0.917 0.909 0.893 0.877 0.870 0.862 0.847 0.833 0.980 0.961 0.943 0.925 0.907 0.890 0.873 0.857 0.842 0.826 0.797 0.769 0.756 0.743 0.718 0.694 0.971 0.942 0.915 0.889 0.864 0.840 0.816 0.794 0.772 0.751 0.712 0.658 0.641 0.609 0.579 0.961 0.924 0.888 0.855 0.823 0.792 0.763 0.572 0.552 0.516 0.482 0.951 0.906 0.863 0.822 0.784 0.747 0.713 0.681 0.650 0.621 0.567 0.519 0.497 0.476 0.437 0.402 0.675 0.735 0.708 0.683 0.636 0.592 0.790 0.746 0.705 0.666 0.665 0.623 0.627 0.582 0.760 0.711 0.731 0.677 0.766 0.703 0.645 0.592 0.544 0.942 0.888 0.837 0.813 0.933 0.871 0.923 0.853 0.789 0.914 0.837 0.905 0.820 0.744 0.676 0.614 0.630 0.596 0.564 0.507 0.583 0.547 0.513 0.452 0.540 0.502 0.467 0.404 0.500 0.460 0424 0.361 0.558 0.508 0.463 0.429 0.388 0.350 0.287 0.397 0.356 0.319 0.257 0.208 0.368 0.326 0.290 0.229 0.182 0.340 0.299 0.263 0.205 0.160 0.315 0.896 0.804 0.722 0.650 0.585 0.527 0475 0.887 0.788 0.701 0.625 0.557 0.497 0.444 0.879 0.773 0.681 0.601 0.530 0.469 0.415 0.870 0.758 0.661 0.577 0.505 0.442 0.388 0.642 0.555 0.481 0.417 0.362 0.861 0.743 0.853 0.728 0.844 0.714 0.836 0.700 0.587 0.494 0.416 0.828 0.686 0.570 0.475 0.396 0.673 0.554 0.456 0.377 0.439 0.359 0.294 0242 0.623 0.534 0.458 0.394 0.339 0.605 0.513 0.436 0.371 0.317 0.350 0.296 0.331 0.277 0.312 0.258 0.820 Period 21 0.811 0.660 0.538 0.456 0.432 0410 0.370 0.335 0.400 0.376 0.354 0.314 0.279 0.351 0.327 0.305 0.266 0.233 0.308 0.284 0.263 0.225 0.194 0.422 0.386 0.322 0.270 0.247 0.227 0.191 0.162 0.237 0.215 0.195 0.162 0.135 0.187 0.168 0.137 0.112 0.163 0.145 0.116 0.093 0.141 0.125 0.099 0.078 0.275 0.239 0.183 0.140 0.123 0.108 0.084 0.065 0.292 0.252 0.218 0.163 0.123 0.107 0.093 0.071 0.054 0.270 0.231 0.198 0.146 0.108 0.093 0.080 0.060 0.045 0.250 0.212 0.180 0.130 0.095 0.081 0.069 0.051 0.038 0.232 0.194 0.164 0.116 0.083 0.070 0.060 0.043 0.031 0.215 0.178 0.149 0.104 0.073 0.061 0.051 0.037 0.026 0.199 0.164 0.135 0.093 0.064 0.053 0.044 0.031 0.022 ré ar q Periods 1% 2% Period 1 Period 2 Period 3 Period 4 Period 5 Period 6 Period 7 Period 8 Period 9 Period 10 Period 11 Period 12 Period 13 Period 14 Period 15 Period 16 Period 17 Period 18 Period 19 Period 20 Period 21 3% 0.990 0.980 0.971 1.970 1.942 1.913 2.941 2.884 2.829 3.902 3.808 3.717 4.853 4.713 4.580 Present Value of Ordinary Annuity of $1 4% 8% 9% 10% 16% 18% 20% 5% 6% 7% 12% 14% 15% 0.962 0.952 0.943 0.935 0.926 0.917 0.909 0.893 0.877 0.870 0.862 0.847 0.833 1.859 1.833 1.808 1.783 1.759 1.736 1.690 1.647 1.626 1.605 1.566 1.528 2.723 2.673 2.577 2.531 2.487 2.402 2.322 2.283 2.246 2.174 2.106 3.312 3.240 3.170 3.037 2.914 2.855 2.798 2.690 2.589 1.886 2.775 3.630 3.546 3.465 4.329 4.212 2.624 3.387 4.100 4.452 3.993 3.890 3.791 3.605 3.433 3.352 3.274 3.127 2.991 5,076 4.917 4.767 5,786 5.582 5.389 5.795 5.601 5.417 5.242 6.728 6.472 6.230 6.002 7.652 7.325 7.020 6.733 6.463 6.210 5.971 8.566 8.162 7.786 7.435 7.108 6.802 6.515 9.471 8.983 8.530 8.111 7.722 7.360 7.024 10.368 9.787 9.253 8.760 8.306 7.887 7.499 11.255 10.575 9.954 9.385 8.863 8.384 7.943 12.134 11.348 10.635 9.986 9.394 8.853 8.358 13.004 12.106 11.296 10.563 9.899 9.295 8.745 13.865 12.849 11.938 11.118 10.380 9.712 9.108 4.623 4.486 4.355 3.685 3.498 3.326 4.111 3.889 3.784 5.206 5.033 4.868 4.564 4.288 4.160 4.039 3.812 3.605 5.747 5.535 5.335 4.968 4.639 4487 4.344 4.078 3.837 6.247 5.995 5.759 5.328 4.946 4.772 4.607 4.303 4.031 6.710 6.418 6.145 5.650 5.216 5.019 4.833 4.494 4.192 7.139 6.805 6.495 5.938 5.453 5.234 7.536 7.161 6.814 6.194 5.660 5.421 7.904 7.487 7.103 6.424 5.842 5.583 8.244 7.786 7.367 6.628 6.002 5.724 8.559 8.061 7.606 6.811 6.142 5.847 14.718 13.578 12.561 11.652 10.838 10.106 9.447 8.851 8.313 7.824 6.974 6.265 5.954 15.562 14.292 13.166 12.166 11.274 10.477 9.763 9.122 8.544 8.022 7.120 6.373 6.047 16.398 14.992 13.754 12.659 11.690 10.828 10.059 9.372 8.756 8.201 7.250 6.467 6.128 5.818 5.273 4.812 17.226 15.678 14.324 13.134 12.085 11.158 10.336 9.604 8.950 8.365 7.366 6.550 6.198 5.877 5.316 4.844 18.046 16.351 14.877 13.590 12.462 11.470 10.594 9.818 9.129 8.514 7.469 6.623 6.259 5.929 5.353 4.870 7.562 6.687 6.312 5.973 5.384 4.891 5.029 4.656 4.327 5.197 4.793 4.439 5.342 4.910 4.533 5.468 5.008 4.611 5.575 5.092 4.675 5.669 5.162 4.730 5.749 5.222 4.775 18.857 17.011 15.415 14.029 12.821 11.764 10.836 10.017 9.292 8.649 sign 1. Compute this project's NPV using Eon's 16% hurdle rate. Should Eon invest in the equipment? 2. Eon could refurbish the equipment at the end of six years for $103,000. The refurbished equipment could be used one more year, providing $72,000 of net cash inflows in year 7. Additionally, the refurbished equipment would have a $53,000 residual value at the end of year 7. Should Eon invest in the equipment and refurbish it after six years? (Hint: In addition to your answer to Requirement 1, discount the additional cash outflow and inflows back to the present value.) g Eon Industries is deciding whether to automate one phase of its production process. The manufacturing equipment has a six-year life and will cost $925,000. Projected net cash inflows are as follows: (Click the icon to view the projected net cash inflows.) (Click the icon to view Present Value of $1 table.) Read the requirements Requirement 1. Compute this project's NPV using Eon's 16 % hurdle rate. Should Eon invest in the equipment? Use the following table to calculate the net present value of the project. (Enter any factor amounts to three decimal places, XXXX Use parentheses or a minus sign for a negative net present value.) Years Year 1 Year 2 Year 3 Year 4 Year 5 Present value of each year's inflow: (n = 1) Present value of each year's inflow: (n=2) Present value of each year's inflow: (n = 3) Present value of each year's inflow: (n = 4) Present value of each year's inflow: (n = 5) Year 6 Present value of each year's inflow: (n = 6) Total PV of cash inflows Year 0 Initial investment (Click the icon to view Present Value of Ordinary Annuity of $1 table.) Net present value of the project Net Cash Inflow $ 265,000 250,000 224,000 214,000 203,000 174,000 PV Factor ( = 16%) 0.862 $ 0.743 0.641 0.552 0.476 0.410 Present Value 228,430 185,750 143,584 118,128 96,628 71,340 Data table Year 1 $ Year 2 Year 3 Year 4 Year 5 Year 6 265,000 250,000 224,000 214,000 203,000 174,000 X Periods Period 1 Period 2 Period 3 Period 4 Period 5 Period 6 Period 7 Period 8 Period 9 Period 10 Period 11 Period 12 Period 13 Period 14 Period 15 Period 16 Period 17 Period 18 Period 19 Period 20 Present Value of $1 1% 2% 3% 5% 4% 6% 7% 8% 9% 10% 12% 14% 15% 16% 18% 20% 0.990 0.980 0.971 0.962 0.952 0.943 0.935 0.926 0.917 0.909 0.893 0.877 0.870 0.862 0.847 0.833 0.980 0.961 0.943 0.925 0.907 0.890 0.873 0.857 0.842 0.826 0.797 0.769 0.756 0.743 0.718 0.694 0.971 0.942 0.915 0.889 0.864 0.840 0.816 0.794 0.772 0.751 0.712 0.658 0.641 0.609 0.579 0.961 0.924 0.888 0.855 0.823 0.792 0.763 0.572 0.552 0.516 0.482 0.951 0.906 0.863 0.822 0.784 0.747 0.713 0.681 0.650 0.621 0.567 0.519 0.497 0.476 0.437 0.402 0.675 0.735 0.708 0.683 0.636 0.592 0.760 0.711 0.790 0.746 0.705 0.666 0.665 0.623 0.627 0.582 0.731 0.677 0.766 0.703 0.645 0.592 0.544 0.942 0.888 0.837 0.813 0.933 0.871 0.923 0.853 0.789 0.914 0.837 0.905 0.820 0.744 0.676 0.614 0.630 0.596 0.564 0.507 0.583 0.547 0.513 0.452 0.540 0.502 0.467 0.404 0.500 0.460 0424 0.361 0.558 0.508 0.463 0.429 0.388 0.350 0.287 0.397 0.356 0.319 0.257 0.208 0.368 0.326 0.290 0.229 0.182 0.340 0.299 0.263 0.205 0.160 0.315 0.896 0.804 0.722 0.650 0.585 0.527 0475 0.887 0.788 0.701 0.625 0.557 0.497 0.444 0.879 0.773 0.681 0.601 0.530 0.469 0.415 0.870 0.758 0.661 0.577 0.505 0.442 0.388 0.642 0.555 0.481 0.417 0.362 0.861 0.743 0.853 0.728 0.844 0.714 0.836 0.700 0.587 0.494 0.416 0.828 0.686 0.570 0.475 0.396 0.673 0.554 0.456 0.377 0.439 0.359 0.294 0242 0.623 0.534 0.458 0.394 0.339 0.605 0.513 0.436 0.371 0.317 0.350 0.296 0.331 0.277 0.312 0.258 0.820 Period 21 0.811 0.660 0.538 0.456 0.432 0410 0.370 0.335 0.400 0.376 0.354 0.314 0.279 0.351 0.327 0.305 0.266 0.233 0.308 0.284 0.263 0.225 0.194 0.422 0.386 0.322 0.270 0.247 0.227 0.191 0.162 0.237 0.215 0.195 0.162 0.135 0.187 0.168 0.137 0.112 0.163 0.145 0.116 0.093 0.141 0.125 0.099 0.078 0.275 0.239 0.183 0.140 0.123 0.108 0.084 0.065 0.292 0.252 0.218 0.163 0.123 0.107 0.093 0.071 0.054 0.270 0.231 0.198 0.146 0.108 0.093 0.080 0.060 0.045 0.250 0.212 0.180 0.130 0.095 0.081 0.069 0.051 0.038 0.232 0.194 0.164 0.116 0.083 0.070 0.060 0.043 0.031 0.215 0.178 0.149 0.104 0.073 0.061 0.051 0.037 0.026 0.199 0.164 0.135 0.093 0.064 0.053 0.044 0.031 0.022 ré ar q Periods 1% 2% Period 1 Period 2 Period 3 Period 4 Period 5 Period 6 Period 7 Period 8 Period 9 Period 10 Period 11 Period 12 Period 13 Period 14 Period 15 Period 16 Period 17 Period 18 Period 19 Period 20 Period 21 3% 0.990 0.980 0.971 1.970 1.942 1.913 2.941 2.884 2.829 3.902 3.808 3.717 4.853 4.713 4.580 Present Value of Ordinary Annuity of $1 4% 8% 9% 10% 16% 18% 20% 5% 6% 7% 12% 14% 15% 0.962 0.952 0.943 0.935 0.926 0.917 0.909 0.893 0.877 0.870 0.862 0.847 0.833 1.859 1.833 1.808 1.783 1.759 1.736 1.690 1.647 1.626 1.605 1.566 1.528 2.723 2.673 2.577 2.531 2.487 2.402 2.322 2.283 2.246 2.174 2.106 3.312 3.240 3.170 3.037 2.914 2.855 2.798 2.690 2.589 1.886 2.775 3.630 3.546 3.465 4.329 4.212 2.624 3.387 4.100 4.452 3.993 3.890 3.791 3.605 3.433 3.352 3.274 3.127 2.991 5,076 4.917 4.767 5,786 5.582 5.389 5.795 5.601 5.417 5.242 6.728 6.472 6.230 6.002 7.652 7.325 7.020 6.733 6.463 6.210 5.971 8.566 8.162 7.786 7.435 7.108 6.802 6.515 9.471 8.983 8.530 8.111 7.722 7.360 7.024 10.368 9.787 9.253 8.760 8.306 7.887 7.499 11.255 10.575 9.954 9.385 8.863 8.384 7.943 12.134 11.348 10.635 9.986 9.394 8.853 8.358 13.004 12.106 11.296 10.563 9.899 9.295 8.745 13.865 12.849 11.938 11.118 10.380 9.712 9.108 4.623 4.486 4.355 3.685 3.498 3.326 4.111 3.889 3.784 5.206 5.033 4.868 4.564 4.288 4.160 4.039 3.812 3.605 5.747 5.535 5.335 4.968 4.639 4487 4.344 4.078 3.837 6.247 5.995 5.759 5.328 4.946 4.772 4.607 4.303 4.031 6.710 6.418 6.145 5.650 5.216 5.019 4.833 4.494 4.192 7.139 6.805 6.495 5.938 5.453 5.234 7.536 7.161 6.814 6.194 5.660 5.421 7.904 7.487 7.103 6.424 5.842 5.583 8.244 7.786 7.367 6.628 6.002 5.724 8.559 8.061 7.606 6.811 6.142 5.847 14.718 13.578 12.561 11.652 10.838 10.106 9.447 8.851 8.313 7.824 6.974 6.265 5.954 15.562 14.292 13.166 12.166 11.274 10.477 9.763 9.122 8.544 8.022 7.120 6.373 6.047 16.398 14.992 13.754 12.659 11.690 10.828 10.059 9.372 8.756 8.201 7.250 6.467 6.128 5.818 5.273 4.812 17.226 15.678 14.324 13.134 12.085 11.158 10.336 9.604 8.950 8.365 7.366 6.550 6.198 5.877 5.316 4.844 18.046 16.351 14.877 13.590 12.462 11.470 10.594 9.818 9.129 8.514 7.469 6.623 6.259 5.929 5.353 4.870 7.562 6.687 6.312 5.973 5.384 4.891 5.029 4.656 4.327 5.197 4.793 4.439 5.342 4.910 4.533 5.468 5.008 4.611 5.575 5.092 4.675 5.669 5.162 4.730 5.749 5.222 4.775 18.857 17.011 15.415 14.029 12.821 11.764 10.836 10.017 9.292 8.649 sign 1. Compute this project's NPV using Eon's 16% hurdle rate. Should Eon invest in the equipment? 2. Eon could refurbish the equipment at the end of six years for $103,000. The refurbished equipment could be used one more year, providing $72,000 of net cash inflows in year 7. Additionally, the refurbished equipment would have a $53,000 residual value at the end of year 7. Should Eon invest in the equipment and refurbish it after six years? (Hint: In addition to your answer to Requirement 1, discount the additional cash outflow and inflows back to the present value.) g Eon Industries is deciding whether to automate one phase of its production process. The manufacturing equipment has a six-year life and will cost $925,000. Projected net cash inflows are as follows: (Click the icon to view the projected net cash inflows.) (Click the icon to view Present Value of $1 table.) Read the requirements Requirement 1. Compute this project's NPV using Eon's 16 % hurdle rate. Should Eon invest in the equipment? Use the following table to calculate the net present value of the project. (Enter any factor amounts to three decimal places, XXXX Use parentheses or a minus sign for a negative net present value.) Years Year 1 Year 2 Year 3 Year 4 Year 5 Present value of each year's inflow: (n = 1) Present value of each year's inflow: (n=2) Present value of each year's inflow: (n = 3) Present value of each year's inflow: (n = 4) Present value of each year's inflow: (n = 5) Year 6 Present value of each year's inflow: (n = 6) Total PV of cash inflows Year 0 Initial investment (Click the icon to view Present Value of Ordinary Annuity of $1 table.) Net present value of the project Net Cash Inflow $ 265,000 250,000 224,000 214,000 203,000 174,000 PV Factor ( = 16%) 0.862 $ 0.743 0.641 0.552 0.476 0.410 Present Value 228,430 185,750 143,584 118,128 96,628 71,340 Data table Year 1 $ Year 2 Year 3 Year 4 Year 5 Year 6 265,000 250,000 224,000 214,000 203,000 174,000 X Periods Period 1 Period 2 Period 3 Period 4 Period 5 Period 6 Period 7 Period 8 Period 9 Period 10 Period 11 Period 12 Period 13 Period 14 Period 15 Period 16 Period 17 Period 18 Period 19 Period 20 Present Value of $1 1% 2% 3% 5% 4% 6% 7% 8% 9% 10% 12% 14% 15% 16% 18% 20% 0.990 0.980 0.971 0.962 0.952 0.943 0.935 0.926 0.917 0.909 0.893 0.877 0.870 0.862 0.847 0.833 0.980 0.961 0.943 0.925 0.907 0.890 0.873 0.857 0.842 0.826 0.797 0.769 0.756 0.743 0.718 0.694 0.971 0.942 0.915 0.889 0.864 0.840 0.816 0.794 0.772 0.751 0.712 0.658 0.641 0.609 0.579 0.961 0.924 0.888 0.855 0.823 0.792 0.763 0.572 0.552 0.516 0.482 0.951 0.906 0.863 0.822 0.784 0.747 0.713 0.681 0.650 0.621 0.567 0.519 0.497 0.476 0.437 0.402 0.675 0.735 0.708 0.683 0.636 0.592 0.790 0.746 0.705 0.666 0.665 0.623 0.627 0.582 0.760 0.711 0.731 0.677 0.766 0.703 0.645 0.592 0.544 0.942 0.888 0.837 0.813 0.933 0.871 0.923 0.853 0.789 0.914 0.837 0.905 0.820 0.744 0.676 0.614 0.630 0.596 0.564 0.507 0.583 0.547 0.513 0.452 0.540 0.502 0.467 0.404 0.500 0.460 0424 0.361 0.558 0.508 0.463 0.429 0.388 0.350 0.287 0.397 0.356 0.319 0.257 0.208 0.368 0.326 0.290 0.229 0.182 0.340 0.299 0.263 0.205 0.160 0.315 0.896 0.804 0.722 0.650 0.585 0.527 0475 0.887 0.788 0.701 0.625 0.557 0.497 0.444 0.879 0.773 0.681 0.601 0.530 0.469 0.415 0.870 0.758 0.661 0.577 0.505 0.442 0.388 0.642 0.555 0.481 0.417 0.362 0.861 0.743 0.853 0.728 0.844 0.714 0.836 0.700 0.587 0.494 0.416 0.828 0.686 0.570 0.475 0.396 0.673 0.554 0.456 0.377 0.439 0.359 0.294 0242 0.623 0.534 0.458 0.394 0.339 0.605 0.513 0.436 0.371 0.317 0.350 0.296 0.331 0.277 0.312 0.258 0.820 Period 21 0.811 0.660 0.538 0.456 0.432 0410 0.370 0.335 0.400 0.376 0.354 0.314 0.279 0.351 0.327 0.305 0.266 0.233 0.308 0.284 0.263 0.225 0.194 0.422 0.386 0.322 0.270 0.247 0.227 0.191 0.162 0.237 0.215 0.195 0.162 0.135 0.187 0.168 0.137 0.112 0.163 0.145 0.116 0.093 0.141 0.125 0.099 0.078 0.275 0.239 0.183 0.140 0.123 0.108 0.084 0.065 0.292 0.252 0.218 0.163 0.123 0.107 0.093 0.071 0.054 0.270 0.231 0.198 0.146 0.108 0.093 0.080 0.060 0.045 0.250 0.212 0.180 0.130 0.095 0.081 0.069 0.051 0.038 0.232 0.194 0.164 0.116 0.083 0.070 0.060 0.043 0.031 0.215 0.178 0.149 0.104 0.073 0.061 0.051 0.037 0.026 0.199 0.164 0.135 0.093 0.064 0.053 0.044 0.031 0.022 ré ar q Periods 1% 2% Period 1 Period 2 Period 3 Period 4 Period 5 Period 6 Period 7 Period 8 Period 9 Period 10 Period 11 Period 12 Period 13 Period 14 Period 15 Period 16 Period 17 Period 18 Period 19 Period 20 Period 21 3% 0.990 0.980 0.971 1.970 1.942 1.913 2.941 2.884 2.829 3.902 3.808 3.717 4.853 4.713 4.580 Present Value of Ordinary Annuity of $1 4% 8% 9% 10% 16% 18% 20% 5% 6% 7% 12% 14% 15% 0.962 0.952 0.943 0.935 0.926 0.917 0.909 0.893 0.877 0.870 0.862 0.847 0.833 1.859 1.833 1.808 1.783 1.759 1.736 1.690 1.647 1.626 1.605 1.566 1.528 2.723 2.673 2.577 2.531 2.487 2.402 2.322 2.283 2.246 2.174 2.106 3.312 3.240 3.170 3.037 2.914 2.855 2.798 2.690 2.589 1.886 2.775 3.630 3.546 3.465 4.329 4.212 2.624 3.387 4.100 4.452 3.993 3.890 3.791 3.605 3.433 3.352 3.274 3.127 2.991 5,076 4.917 4.767 5,786 5.582 5.389 5.795 5.601 5.417 5.242 6.728 6.472 6.230 6.002 7.652 7.325 7.020 6.733 6.463 6.210 5.971 8.566 8.162 7.786 7.435 7.108 6.802 6.515 9.471 8.983 8.530 8.111 7.722 7.360 7.024 10.368 9.787 9.253 8.760 8.306 7.887 7.499 11.255 10.575 9.954 9.385 8.863 8.384 7.943 12.134 11.348 10.635 9.986 9.394 8.853 8.358 13.004 12.106 11.296 10.563 9.899 9.295 8.745 13.865 12.849 11.938 11.118 10.380 9.712 9.108 4.623 4.486 4.355 3.685 3.498 3.326 4.111 3.889 3.784 5.206 5.033 4.868 4.564 4.288 4.160 4.039 3.812 3.605 5.747 5.535 5.335 4.968 4.639 4487 4.344 4.078 3.837 6.247 5.995 5.759 5.328 4.946 4.772 4.607 4.303 4.031 6.710 6.418 6.145 5.650 5.216 5.019 4.833 4.494 4.192 7.139 6.805 6.495 5.938 5.453 5.234 7.536 7.161 6.814 6.194 5.660 5.421 7.904 7.487 7.103 6.424 5.842 5.583 8.244 7.786 7.367 6.628 6.002 5.724 8.559 8.061 7.606 6.811 6.142 5.847 14.718 13.578 12.561 11.652 10.838 10.106 9.447 8.851 8.313 7.824 6.974 6.265 5.954 15.562 14.292 13.166 12.166 11.274 10.477 9.763 9.122 8.544 8.022 7.120 6.373 6.047 16.398 14.992 13.754 12.659 11.690 10.828 10.059 9.372 8.756 8.201 7.250 6.467 6.128 5.818 5.273 4.812 17.226 15.678 14.324 13.134 12.085 11.158 10.336 9.604 8.950 8.365 7.366 6.550 6.198 5.877 5.316 4.844 18.046 16.351 14.877 13.590 12.462 11.470 10.594 9.818 9.129 8.514 7.469 6.623 6.259 5.929 5.353 4.870 7.562 6.687 6.312 5.973 5.384 4.891 5.029 4.656 4.327 5.197 4.793 4.439 5.342 4.910 4.533 5.468 5.008 4.611 5.575 5.092 4.675 5.669 5.162 4.730 5.749 5.222 4.775 18.857 17.011 15.415 14.029 12.821 11.764 10.836 10.017 9.292 8.649 sign 1. Compute this project's NPV using Eon's 16% hurdle rate. Should Eon invest in the equipment? 2. Eon could refurbish the equipment at the end of six years for $103,000. The refurbished equipment could be used one more year, providing $72,000 of net cash inflows in year 7. Additionally, the refurbished equipment would have a $53,000 residual value at the end of year 7. Should Eon invest in the equipment and refurbish it after six years? (Hint: In addition to your answer to Requirement 1, discount the additional cash outflow and inflows back to the present value.) g Eon Industries is deciding whether to automate one phase of its production process. The manufacturing equipment has a six-year life and will cost $925,000. Projected net cash inflows are as follows: (Click the icon to view the projected net cash inflows.) (Click the icon to view Present Value of $1 table.) Read the requirements Requirement 1. Compute this project's NPV using Eon's 16 % hurdle rate. Should Eon invest in the equipment? Use the following table to calculate the net present value of the project. (Enter any factor amounts to three decimal places, XXXX Use parentheses or a minus sign for a negative net present value.) Years Year 1 Year 2 Year 3 Year 4 Year 5 Present value of each year's inflow: (n = 1) Present value of each year's inflow: (n=2) Present value of each year's inflow: (n = 3) Present value of each year's inflow: (n = 4) Present value of each year's inflow: (n = 5) Year 6 Present value of each year's inflow: (n = 6) Total PV of cash inflows Year 0 Initial investment (Click the icon to view Present Value of Ordinary Annuity of $1 table.) Net present value of the project Net Cash Inflow $ 265,000 250,000 224,000 214,000 203,000 174,000 PV Factor ( = 16%) 0.862 $ 0.743 0.641 0.552 0.476 0.410 Present Value 228,430 185,750 143,584 118,128 96,628 71,340 Data table Year 1 $ Year 2 Year 3 Year 4 Year 5 Year 6 265,000 250,000 224,000 214,000 203,000 174,000 X Periods Period 1 Period 2 Period 3 Period 4 Period 5 Period 6 Period 7 Period 8 Period 9 Period 10 Period 11 Period 12 Period 13 Period 14 Period 15 Period 16 Period 17 Period 18 Period 19 Period 20 Present Value of $1 1% 2% 3% 5% 4% 6% 7% 8% 9% 10% 12% 14% 15% 16% 18% 20% 0.990 0.980 0.971 0.962 0.952 0.943 0.935 0.926 0.917 0.909 0.893 0.877 0.870 0.862 0.847 0.833 0.980 0.961 0.943 0.925 0.907 0.890 0.873 0.857 0.842 0.826 0.797 0.769 0.756 0.743 0.718 0.694 0.971 0.942 0.915 0.889 0.864 0.840 0.816 0.794 0.772 0.751 0.712 0.658 0.641 0.609 0.579 0.961 0.924 0.888 0.855 0.823 0.792 0.763 0.572 0.552 0.516 0.482 0.951 0.906 0.863 0.822 0.784 0.747 0.713 0.681 0.650 0.621 0.567 0.519 0.497 0.476 0.437 0.402 0.675 0.735 0.708 0.683 0.636 0.592 0.790 0.746 0.705 0.666 0.665 0.623 0.627 0.582 0.760 0.711 0.731 0.677 0.766 0.703 0.645 0.592 0.544 0.942 0.888 0.837 0.813 0.933 0.871 0.923 0.853 0.789 0.914 0.837 0.905 0.820 0.744 0.676 0.614 0.630 0.596 0.564 0.507 0.583 0.547 0.513 0.452 0.540 0.502 0.467 0.404 0.500 0.460 0424 0.361 0.558 0.508 0.463 0.429 0.388 0.350 0.287 0.397 0.356 0.319 0.257 0.208 0.368 0.326 0.290 0.229 0.182 0.340 0.299 0.263 0.205 0.160 0.315 0.896 0.804 0.722 0.650 0.585 0.527 0475 0.887 0.788 0.701 0.625 0.557 0.497 0.444 0.879 0.773 0.681 0.601 0.530 0.469 0.415 0.870 0.758 0.661 0.577 0.505 0.442 0.388 0.642 0.555 0.481 0.417 0.362 0.861 0.743 0.853 0.728 0.844 0.714 0.836 0.700 0.587 0.494 0.416 0.828 0.686 0.570 0.475 0.396 0.673 0.554 0.456 0.377 0.439 0.359 0.294 0242 0.623 0.534 0.458 0.394 0.339 0.605 0.513 0.436 0.371 0.317 0.350 0.296 0.331 0.277 0.312 0.258 0.820 Period 21 0.811 0.660 0.538 0.456 0.432 0410 0.370 0.335 0.400 0.376 0.354 0.314 0.279 0.351 0.327 0.305 0.266 0.233 0.308 0.284 0.263 0.225 0.194 0.422 0.386 0.322 0.270 0.247 0.227 0.191 0.162 0.237 0.215 0.195 0.162 0.135 0.187 0.168 0.137 0.112 0.163 0.145 0.116 0.093 0.141 0.125 0.099 0.078 0.275 0.239 0.183 0.140 0.123 0.108 0.084 0.065 0.292 0.252 0.218 0.163 0.123 0.107 0.093 0.071 0.054 0.270 0.231 0.198 0.146 0.108 0.093 0.080 0.060 0.045 0.250 0.212 0.180 0.130 0.095 0.081 0.069 0.051 0.038 0.232 0.194 0.164 0.116 0.083 0.070 0.060 0.043 0.031 0.215 0.178 0.149 0.104 0.073 0.061 0.051 0.037 0.026 0.199 0.164 0.135 0.093 0.064 0.053 0.044 0.031 0.022 ré ar q Periods 1% 2% Period 1 Period 2 Period 3 Period 4 Period 5 Period 6 Period 7 Period 8 Period 9 Period 10 Period 11 Period 12 Period 13 Period 14 Period 15 Period 16 Period 17 Period 18 Period 19 Period 20 Period 21 3% 0.990 0.980 0.971 1.970 1.942 1.913 2.941 2.884 2.829 3.902 3.808 3.717 4.853 4.713 4.580 Present Value of Ordinary Annuity of $1 4% 8% 9% 10% 16% 18% 20% 5% 6% 7% 12% 14% 15% 0.962 0.952 0.943 0.935 0.926 0.917 0.909 0.893 0.877 0.870 0.862 0.847 0.833 1.859 1.833 1.808 1.783 1.759 1.736 1.690 1.647 1.626 1.605 1.566 1.528 2.723 2.673 2.577 2.531 2.487 2.402 2.322 2.283 2.246 2.174 2.106 3.312 3.240 3.170 3.037 2.914 2.855 2.798 2.690 2.589 1.886 2.775 3.630 3.546 3.465 4.329 4.212 2.624 3.387 4.100 4.452 3.993 3.890 3.791 3.605 3.433 3.352 3.274 3.127 2.991 5,076 4.917 4.767 5,786 5.582 5.389 5.795 5.601 5.417 5.242 6.728 6.472 6.230 6.002 7.652 7.325 7.020 6.733 6.463 6.210 5.971 8.566 8.162 7.786 7.435 7.108 6.802 6.515 9.471 8.983 8.530 8.111 7.722 7.360 7.024 10.368 9.787 9.253 8.760 8.306 7.887 7.499 11.255 10.575 9.954 9.385 8.863 8.384 7.943 12.134 11.348 10.635 9.986 9.394 8.853 8.358 13.004 12.106 11.296 10.563 9.899 9.295 8.745 13.865 12.849 11.938 11.118 10.380 9.712 9.108 4.623 4.486 4.355 3.685 3.498 3.326 4.111 3.889 3.784 5.206 5.033 4.868 4.564 4.288 4.160 4.039 3.812 3.605 5.747 5.535 5.335 4.968 4.639 4487 4.344 4.078 3.837 6.247 5.995 5.759 5.328 4.946 4.772 4.607 4.303 4.031 6.710 6.418 6.145 5.650 5.216 5.019 4.833 4.494 4.192 7.139 6.805 6.495 5.938 5.453 5.234 7.536 7.161 6.814 6.194 5.660 5.421 7.904 7.487 7.103 6.424 5.842 5.583 8.244 7.786 7.367 6.628 6.002 5.724 8.559 8.061 7.606 6.811 6.142 5.847 14.718 13.578 12.561 11.652 10.838 10.106 9.447 8.851 8.313 7.824 6.974 6.265 5.954 15.562 14.292 13.166 12.166 11.274 10.477 9.763 9.122 8.544 8.022 7.120 6.373 6.047 16.398 14.992 13.754 12.659 11.690 10.828 10.059 9.372 8.756 8.201 7.250 6.467 6.128 5.818 5.273 4.812 17.226 15.678 14.324 13.134 12.085 11.158 10.336 9.604 8.950 8.365 7.366 6.550 6.198 5.877 5.316 4.844 18.046 16.351 14.877 13.590 12.462 11.470 10.594 9.818 9.129 8.514 7.469 6.623 6.259 5.929 5.353 4.870 7.562 6.687 6.312 5.973 5.384 4.891 5.029 4.656 4.327 5.197 4.793 4.439 5.342 4.910 4.533 5.468 5.008 4.611 5.575 5.092 4.675 5.669 5.162 4.730 5.749 5.222 4.775 18.857 17.011 15.415 14.029 12.821 11.764 10.836 10.017 9.292 8.649 sign 1. Compute this project's NPV using Eon's 16% hurdle rate. Should Eon invest in the equipment? 2. Eon could refurbish the equipment at the end of six years for $103,000. The refurbished equipment could be used one more year, providing $72,000 of net cash inflows in year 7. Additionally, the refurbished equipment would have a $53,000 residual value at the end of year 7. Should Eon invest in the equipment and refurbish it after six years? (Hint: In addition to your answer to Requirement 1, discount the additional cash outflow and inflows back to the present value.)
Expert Answer:
Answer rating: 100% (QA)
Requirement 1 Years Net Cash Inflow PV Factor i16 1 n1 265000 0862 2 n2 250000 ... View the full answer

Related Book For 
Horngrens Financial and Managerial Accounting
ISBN: 978-0133866292
5th edition
Authors: Tracie L. Nobles, Brenda L. Mattison, Ella Mae Matsumura
Posted Date:
Students also viewed these mathematics questions
-
Eon Industries is deciding whether to automate one phase of its production process. The manufacturing equipment has a six-year life and will cost $920,000. Projected net cash inflows are as follows:...
-
Kerwin Industries is deciding whether to automate one phase of its production process. The manufacturing equipment has a six-year life and will cost $905,000. Projected net cash inflows are as...
-
Christina is trying to save money in her bank account. She decides that she can deposit $1000 each month into the account. The account earns 2.3% interest each month. How much money will be in the...
-
In what ways are national income statistics useful?
-
1. Go to finance.yahoo.com and download the ending monthly stock prices for Colgate-Palmolive for the last 60 months. Use the adjusted closing price, which adjusts for dividend payments and stock...
-
Indicate whether the following statements, a through \(g\), are better indicators of (1) lean manufacturing, (2) flexible manufacturing, or (3) both lean and flexible manufacturing. a. A central...
-
According to results from the Spine Patient Outcomes Research Trial, or SPORT, surgery for a painful, common back condition resulted in significantly reduced back pain and better physical function...
-
Perdue Company purchased equipment on April 1 for $ 5 8 , 3 2 0 . The equipment was expected to have a useful life of three years, or 7 , 5 6 0 operating hours, and a residual value of $ 1 , 6 2 0 ....
-
Singularity in density of states (a) From the dispersion relation derived for a monatomic linear lattice of N atoms with nearest-neighbor interactions, show the density of modes is D(w) = 2N/ 1 /(w 2...
-
Base Electronics buys 5,000 common shares in Blue Mission Company for $10 per share on January 2 of the current year. Base owns 34% of Blue Mission voting shares and intends to hold on to it for...
-
Consider the following quadratic equation: 2x(5x-1) x = 1 Find the solutions to this equation by factoring in standard form. Enter the rational solutions in the spaces indicated below as decimals to...
-
A company makes a product. They will need to purchase 18,000 units of a specialized component at a cost of $60 each. It costs $150 to make a purchase. The relevant carrying costs (material handling)...
-
Consider an individual of height h = 164 cm. If the pressure in the person's veins in their feet is p = 99 mm Hg, what is the pressure in the veins at the top of their skull (in units of mm Hg)? Only...
-
Vegas Company has the following unit costs: Variable manufacturing overhead Direct materials $25 20 Direct labor Fixed manufacturing overhead Variable marketing and administrative 19 12 7 Vegas...
-
Differentiate between write through and write back procdre in contect of cache memory with suitable example The access time of a cache memory is 95 ns and that of main memory 1000 ns. It is estimated...
-
Write a C++ program to evaluate postfix expressions. Your program should take postfix expression as an input, process it with the help of stack and display the resultafter performing required...
-
We all experience emotions, but some people disguise their true feelings better than others. Do you think this is a helpful or harmful thing to do? Under what conditions do you think it would be most...
-
Refer to Exercise El 9-23. The president of Southern suspects that her allocation of indirect costs could be giving misleading results, so she decides to develop an ABC system. She identifies three...
-
Journalize the following sales transactions for Double Z Archery using the periodic inventory system. Explanations are not required. Aug. 1 Sold $7,800 of equipment on account, credit terms are 2/10,...
-
Park and Fly, near an airport, incurred the following costs to acquire land, make land improvements, and construct and furnish a small building: Park and Fly depreciates land improvements over 20...
-
American Paging, Inc., is the seventh largest paging company in the United States. In a recent balance sheet, it reported a current liability of \(\$ 8,452,379\) that was labeled Unearned Revenues...
-
What do the following terms mean? (a) term loan, (b) bonds payable, (c) trustee, (d) secured bonds, (e) serial bonds, (f) call provision, (g) convertible bonds, (h) face value, (i) coupon rate, (j)...
-
What are contingent liabilities? List three examples of contingent liabilities. When should contingent liabilities be recorded in the accounts?

Study smarter with the SolutionInn App