

Question: Peer response #1 - Looking at your peer's Excel output, and the Regression Equation they wrote out do the following: Interpret the slope of their
- Peer response #1 - Looking at your peer's Excel output, and the Regression Equation they wrote out do the following:
- Interpret theslopeof their Regression Equation.
- Use their Regression Equation to make a prediction. SHOW YOUR WORK. For Example, if your peer used Year to predict Price, plug in a Year value into the regression equation and use it to predict the Price of a vehicle. Does this predicted Price value make sense with their data?
- Find the 95% prediction interval for your prediction. SHOW YOUR WORK. Use the steps outlined on the Prediction Interval Handy Helper:Prediction Intervals
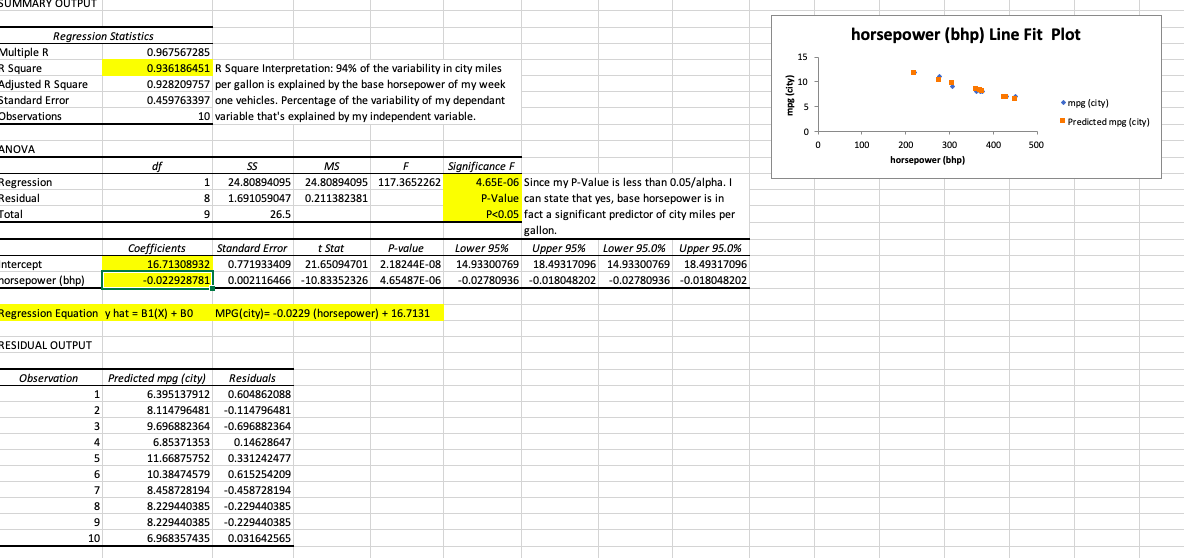
UMMARY C Regression Statistics horsepower (bhp) Line Fit Plot Multiple R 0.967567285 15 Square 0.936186451 R Square Interpretation: 94% of the variability in city miles Adjusted R Square 0.928209757 per gallon is explained by the base horsepower of my week 10 mpg (city) Standard Error 0.459763397 one vehicles. Percentage of the variability of my dependant * mpg (city) Observations 10 variable that's explained by my independent variable. Predicted mpg (city) 100 200 300 400 500 ANOVA horsepower (bhp) df SS MS F Significance F Regression 1 24.80894095 24.80894095 117.3652262 4.65E-06 Since my P-Value is less than 0.05/alpha. I residual 1.691059047 0.211382381 P-Value can state that yes, base horsepower is in LD DO Total 26.5 P
Step by Step Solution
There are 3 Steps involved in it

Get step-by-step solutions from verified subject matter experts