

Question: g Started Disney ESPN @ Yahoo @ Blackboard Learn @ SecureWEB Login > > other Bookmarks The following chart shows monthly figures for Apple stock
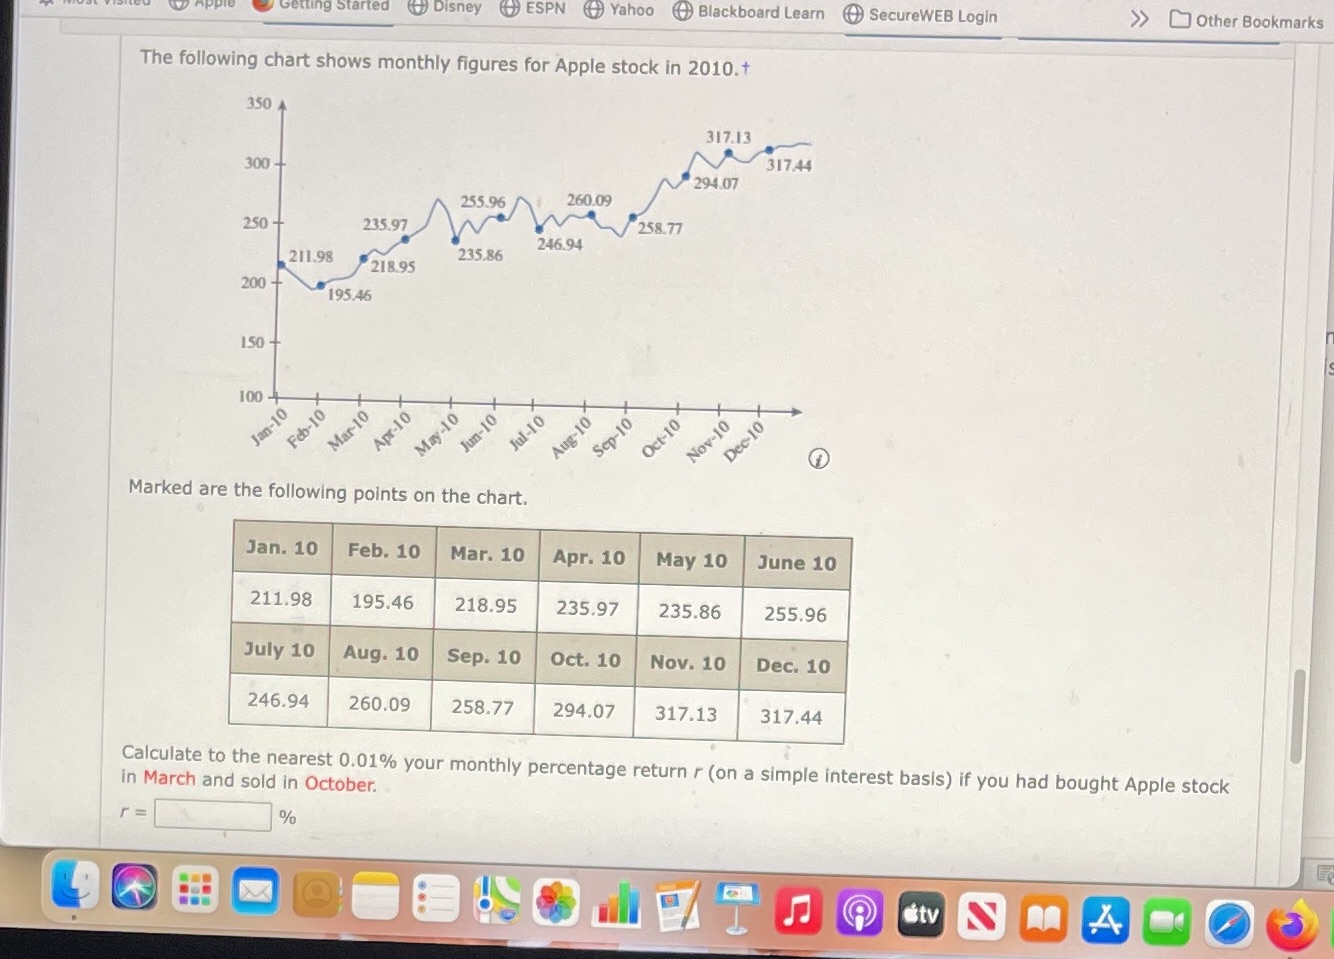
g Started Disney ESPN @ Yahoo @ Blackboard Learn @ SecureWEB Login > > other Bookmarks The following chart shows monthly figures for Apple stock in 2010.+ 350 4 317.13 300- 317.44 294.07 255.96 260.09 250 + 235.97 258.77 246.94 211.98 235.86 218.95 200-+ 195.46 150 - 100 - Jan-10 Feb-10 -10 Mar-10 Apr-10 May-10 Jul-10 Sep- 10 Dec-10 Aug Oct Nov-10 Marked are the following points on the chart. Jan. 10 Feb. 10 Mar. 10 Apr. 10 May 10 June 10 211.98 195.46 218.95 235.97 235.86 255.96 July 10 Aug. 10 Sep. 10 Oct. 10 Nov. 10 Dec. 10 246.94 260.09 258.77 294.07 317.13 317.44 Calculate to the nearest 0.01% your monthly percentage return r (on a simple interest basis) if you had bought Apple stock in March and sold in October. r = tv SMALOE
Step by Step Solution
There are 3 Steps involved in it

Get step-by-step solutions from verified subject matter experts