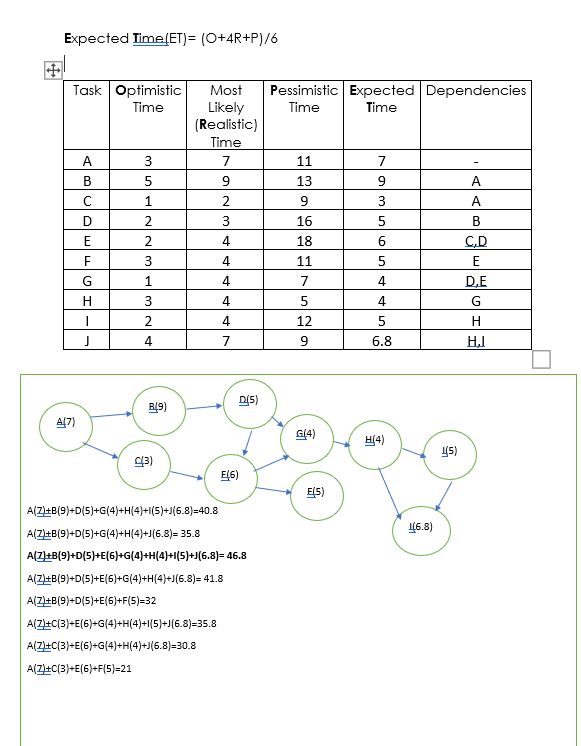
Question: Gantt chart for this network diagram : Expected Time (ET)= (O+4R+P)/6 Task Optimistic Time Pessimistic Expected Dependencies Time Time Most Likely (Realistic) Time 7 9

Gantt chart for this network diagram :

Gantt chart for this network diagram : Expected

Expected Time (ET)= (O+4R+P)/6 Task Optimistic Time Pessimistic Expected Dependencies Time Time Most Likely (Realistic) Time 7 9 3 B 7 9 1 2 3 D 11 13 9 16 18 11 7 5 5 6 4 2 2 3 1 E F 4 5 4 A A B CD E DE G H HI G 4 H 4 4 I 3 2 4 4 12 5 J 7 9 6.8 D(5) 819 A7) 614) H14 145) 943) E46) E(5) 16.8) A(Z1+B(9)+D(5)+G(4)+H(4)+1(5)+J(6.8)=40.8 AZlt (9}+D{5}+G(4)+H[4]+[6.8)= 35.8 A(Z)+B(9)+D(5)+E(6)+G(4)+H(4)+1(5)+7(6.8)= 46.8 A(Zl+B(9)+D(5)+E(6)+G(4)+H(4)+7(6.8)= 41.8 A(Z1+B(9)+D(5)+E(6)+F(5)=32 A(ZI+C(3)=E(6)=G(4)+H(4)+1(5)+J(6.8)=35.8 A(Z+C(3)=E(6)=G(4)+H(4)+)(5.8)=30.8 A(Z+C(3)=E(6)+F(5)=21

Step by Step Solution

There are 3 Steps involved in it

1 Expert Approved Answer
Step: 1 Unlock blur-text-image
Question Has Been Solved by an Expert!

Get step-by-step solutions from verified subject matter experts

Step: 2 Unlock
Step: 3 Unlock

Students Have Also Explored These Related General Management Questions!