

Question: Garmin - Finding an Optimal Capital Structure Javier Estrada The summer of 2019 was fast approaching and Douglas Boessen, Garmin's CFO, was adamant that he
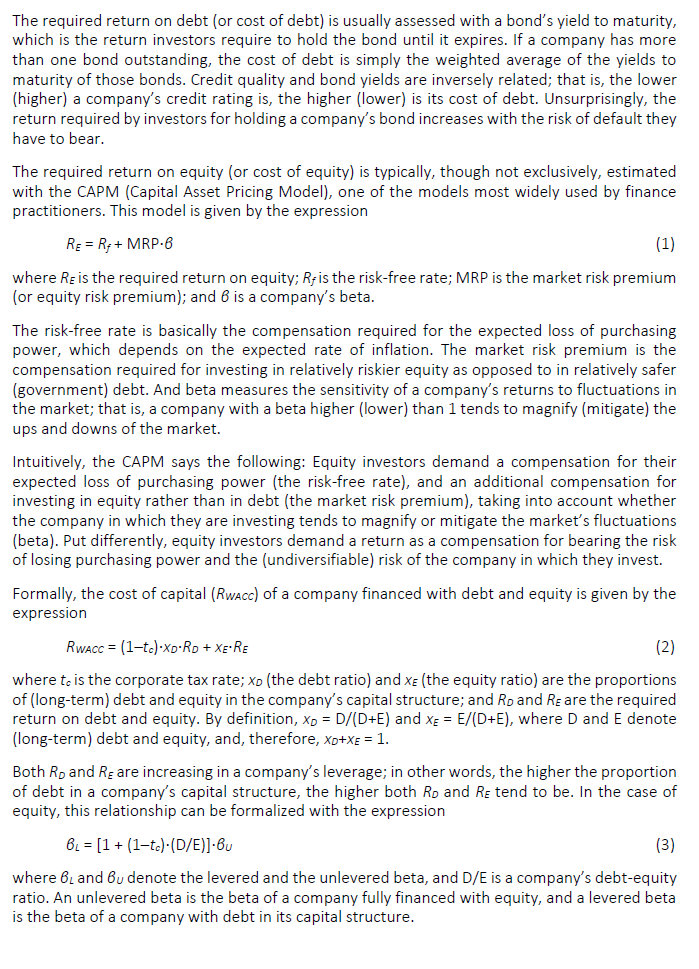
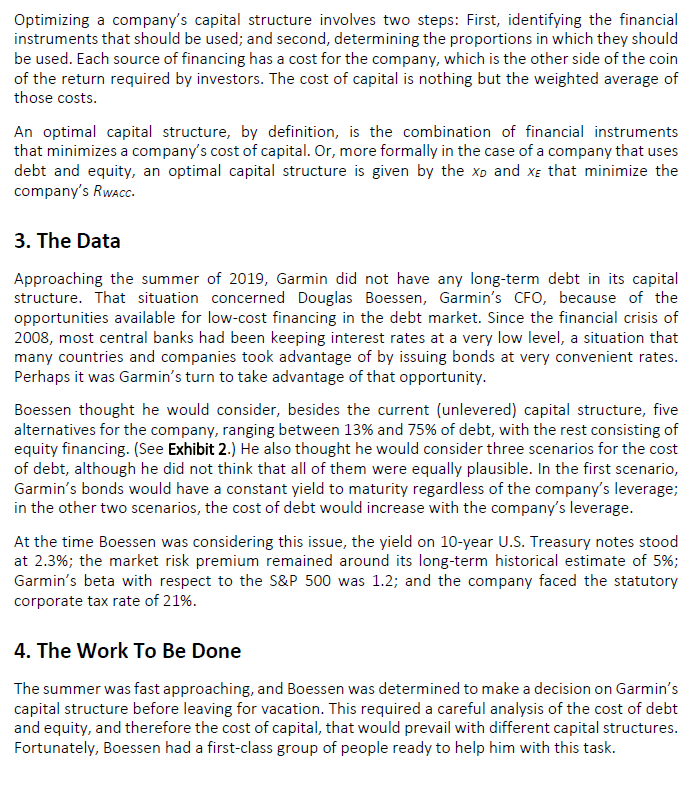
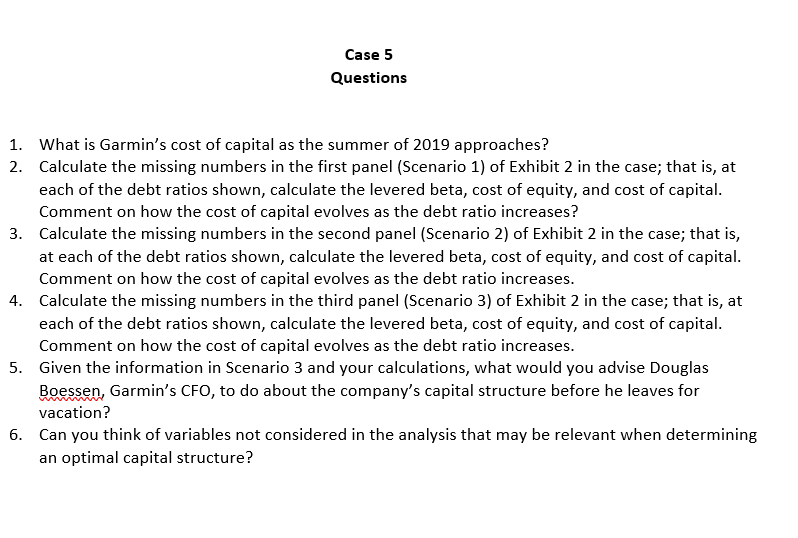
Garmin - Finding an Optimal Capital Structure Javier Estrada The summer of 2019 was fast approaching and Douglas Boessen, Garmin's CFO, was adamant that he would not leave for vacation before dealing with the long-postponed review of the company's capital structure. Garmin did not have any long-term debt and Boessen thought that given the environment of low interest rates, the company would benefit from tapping the bond market. This case is designed to assess Garmin's capital structure and discuss whether the company should add debt to it. 1. The Company Garmin was founded in 1989 in Lenexa, Kansas, under the name ProNav. The company later changed its name to Garmin, which is based on the names of its founders, Gary Burrell and Min Kao. Although it is largely known for its wearable technology for sport enthusiasts, Garmin specializes in GPS technology more broadly, operating through five segments, namely, auto, aviation, fitness, marine, and outdoor. Garmin is in the S&P 500 index and trades in the Nasdaq. Its operations are headquartered in Olathe, Kansas, and its legal domicile is in Schaffhausen, Switzerland. In 2018, the company delivered almost 15 million products, reached a landmark 200 million products sold since inception, had sales of over $3.3 billion, and obtained profits of almost $700 million. (See Exhibit 1.) 2. A Brief Primer on Capital Structure A company's capital structure essentially refers to the combination of financial instruments used to finance its investment projects. Although typically thought of as debt and equity, a company's capital structure can have fewer than two instruments (for example, a company fully financed by equity) or more than two (for example a company financed by equity, debt, preferred equity, and convertible debt).The required return on debt (or cost of debt) is usually assessed with a bond's yield to maturity, which is the return investors require to hold the bond until it expires. If a company has more than one bond outstanding, the cost of debt is simply the weighted average of the yields to maturity of those bonds. Credit quality and bond yields are inversely related; that is, the lower (higher) a company's credit rating is, the higher (lower) is its cost of debt. Unsurprisingly, the return required by investors for holding a company's bond increases with the risk of default they have to bear. The required return on equity (or cost of equity) is typically, though not exclusively, estimated with the CAPM (Capital Asset Pricing Model), one of the models most widely used by finance practitioners. This model is given by the expression RE = Rf + MRP.6 (1) where RE is the required return on equity; Ry is the risk-free rate; MRP is the market risk premium (or equity risk premium); and 6 is a company's beta. The risk-free rate is basically the compensation required for the expected loss of purchasing power, which depends on the expected rate of inflation. The market risk premium is the compensation required for investing in relatively riskier equity as opposed to in relatively safer (government) debt. And beta measures the sensitivity of a company's returns to fluctuations in the market; that is, a company with a beta higher (lower) than 1 tends to magnify (mitigate) the ups and downs of the market. Intuitively, the CAPM says the following: Equity investors demand a compensation for their expected loss of purchasing power (the risk-free rate), and an additional compensation for investing in equity rather than in debt (the market risk premium), taking into account whether the company in which they are investing tends to magnify or mitigate the market's fluctuations (beta). Put differently, equity investors demand a return as a compensation for bearing the risk of losing purchasing power and the (undiversifiable) risk of the company in which they invest. Formally, the cost of capital (RwAcc) of a company financed with debt and equity is given by the expression RWACC = (1-tc).XD.RD + XE.RE (2) where to is the corporate tax rate; xo (the debt ratio) and xE (the equity ratio) are the proportions of (long-term) debt and equity in the company's capital structure; and Ro and RE are the required return on debt and equity. By definition, XD = D/(D+E) and XE = E/(D+E), where D and E denote (long-term) debt and equity, and, therefore, XD+XE = 1. Both Ro and Re are increasing in a company's leverage; in other words, the higher the proportion of debt in a company's capital structure, the higher both Ro and Re tend to be. In the case of equity, this relationship can be formalized with the expression 61 = [1 + (1-te).(D/E)]-6u (3) where 6 and 6v denote the levered and the unlevered beta, and D/E is a company's debt-equity ratio. An unlevered beta is the beta of a company fully financed with equity, and a levered beta is the beta of a company with debt in its capital structure.Optimizing a company's capital structure involves two steps: First, identifying the financial instruments that should be used; and second, determining the proportions in which they should be used. Each source of financing has a cost for the company, which is the other side ofthe coin of the return required by investors. The cost of capital is nothing but the weighted average of those costs. An optimal capital structure, by definition, is the combination of financial instruments that minimizes a company's cost of capital. Or, more formally in the case ofa company that uses debt and equity, an optimal capital structure is given by the X9 and sit- that minimize the company's Rmcc. 3. The Data Approaching the summer of sale, Garmin did not have any longterm debt in its capital structure. That situation concerned Douglas Boessen, Garmin's CFC}, because of the opportunities available for low-cost financing in the debt market. Since the financial crisis of EDGE, most central banks had been keeping interest rates at a very low level, a situation that many countries and companies took advantage of by issuing bonds at very convenient rates. Perhaps it was lSarmin's turn to take advantage of that opportunity. Eoessen thought he would consider, besides the current [unleveredl capital structure, five alternatives for the company, ranging between 139-6 and T596 of debt, with the rest consisting of equity financing. [See Exhibit 2.} He also thought he would consider three scenarios for the cost of debt, although he did not think that all ofthem were equally plausible. In the first scenario, Garmin's bonds would have a constant yield to maturity regardless of the company's leverage; in the other two scenarios, the cost of debt would increase with the company's leverage. At the time Eloessen was considering this issue, the yield on I'Dyear U.S. Treasury notes stood at 2.3%; the market risk premium remained around its longterm historical estimate of 59-6; Garmin's beta with respect to the Evil? SDI] was 1.2; and the company faced the statutory corporate tax rate of 21%. ii. The l.l'sl'ork To Be Done The summer was fast approaching, and Boessen was determined to make a decision on Garmin's capital structure before leaving for vacation. This required a careful analysis ofthe cost of debt and equity, and therefore the cost of capital, that would prevail with different capital structures. Fortunately, Eoessen had a firstclass group of people ready to help him with this task. Exhibit 1 Balance Sheet and Income Statement (Thousands of $) Balance Sheet 2018 Income Statement 2018 Assets Net sales 3,347,444 Cash and cash equivalents 1,201,732 Cost of goods sold 1,367,725 Marketable securities 182,989 Gross profit 1,979,719 Accounts receivable 569,833 Advertising expense 155,394 Inventories 561,840 SG&A expenses 478,177 Other current assets 148,974 R&D expense 567,805 Total current assets 2,665,368 Operating income 778,343 Net property and equipment 663,527 Other income 52,520 Other assets 2,053,963 Other expenses 7,616 Total assets 5,382,858 Income before taxes 823,247 Liabilities and Stockholders' Equity Income tax provision 129,167 Total current liabilities 921,313 Net income 694,080 Other liabilities 298,571 Total shareholders' equity 4,162,974 Total liabilities and shareholders' equity 5,382,858 Source: Garmin, "2018 Annual Report," Garmin, last modified December 31, 2018, https://www8.garmin.com/aboutGarmin/invRelations/reports/2018_Annual_Report.pdf Exhibit 2 Capital Structure Optimization - Three Scenarios Scenario 1 Debt ratio 0% 15% 30% 45% 60% 75% Cost of debt 3.0% 3.0% 3.0% 3.0% 3.0% 3.0% Levered beta ? ? ? ? Cost of equity Cost of capital Scenario 2 Debt ratio % 15% 30% 45% 60% 75% Cost of debt 3.0% 3.1% 3.5% 4.1% 5.1% 6.3% Levered beta ? ? ? Cost of equity Cost of capital Scenario 3 Debt ratio 13% 28% 34% 42% 57% 70% Cost of debt 2.4% 2.8% 2.9% 3.9% 5.2% 8.5% Levered beta Cost of equity Cost of capital "Debt ratio" is long-term debt divided by the sum of long-term debt and equity.Case 5 lElur-sstions What is Garmin's cost of capital as the summer of 2019 approaches? Calculate the missing numbers in the first panel [Scenario 1} of Exhibit 2 in the case; that is, at each of the debt ratios shown, calculate the levered beta, cost of equity, and cost of capital. Comment on how the cost of capital evolves as the debt ratio increases? Calculate the missing numbers in the second panel {Scenario 2} of Exhibit 2 in the case; that is, at each of the debt ratios shown, calculate the levered beta, cost of equity, and cost of capital. Comment on how the cost of capital evolves as the debt ratio increases. Calculate the missing numbers in the third panel {Scenario 3} of Exhibit 2 in the case; that is, at each of the debt ratios shown, calculate the levered beta, cost of equity, and cost of capital. Comment on how the cost of capital evolves as the debt ratio increases. Given the information in Scenario 3 and your calculations, what would you advise Douglas Eoessen, Garmin's CFC}, to do about the company's capital structure before he leaves for vacation? Can you think of variables not considered in the analysis that may be relevant when determining an optimal capital structure
Step by Step Solution
There are 3 Steps involved in it

Get step-by-step solutions from verified subject matter experts