

Question: Give a well supported paragraph interpreting each graph: What does that graph represent? What does the shape of the graph tell you about how the
- Give a well supported paragraph interpreting each graph: What does that graph represent? What does the shape of the graph tell you about how the data have changed over time?
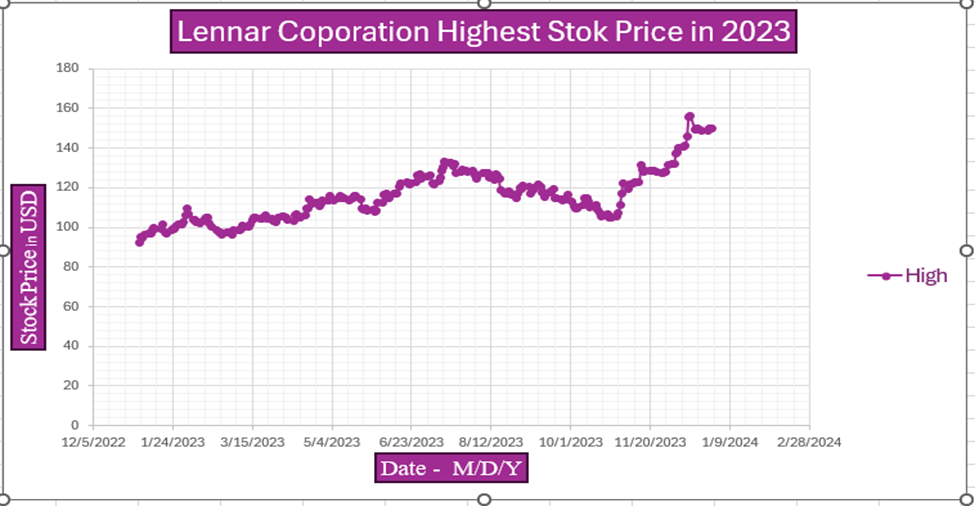
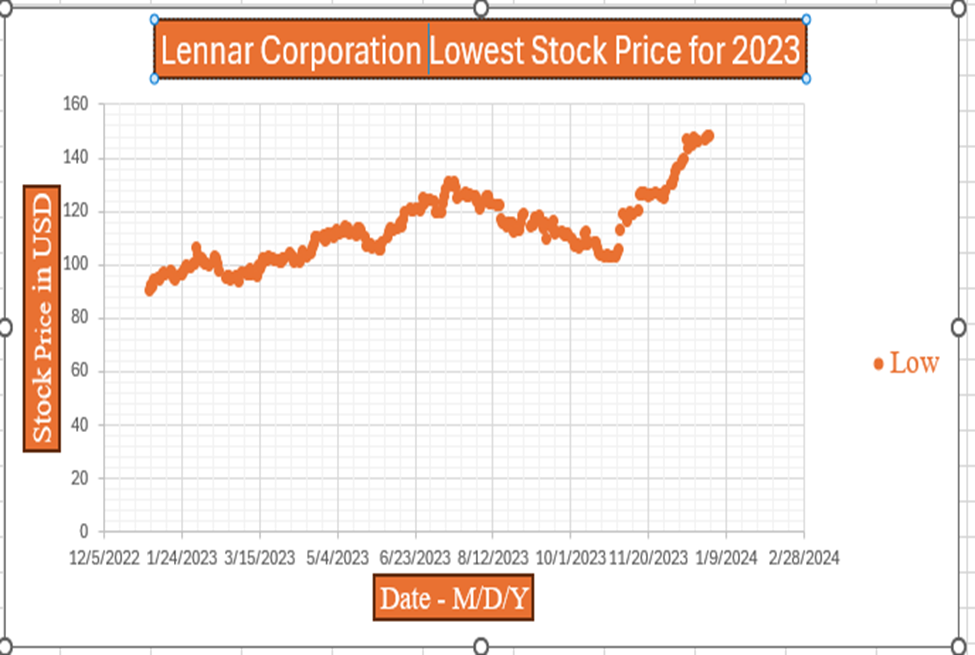
Lennar Coporation Highest Stok Price in 2023 180 160 140 120 100 Stock Price in USD BO -High 60 40 20 0 12/5/2022 1/24/2023 3/15/2023 5/4/2023 6/23/2023 8/12/2023 10/1/2023 11/20/2023 1/9/2024 2/28/2024 Date - M/D/YLennar Corporation Lowest Stock Price for 2023 160 140 120 100 Stock Price in USD 80 O . Low 60 40 20 0 12/5/2022 1/24/2023 3/15/2023 5/4/2023 6/23/2023 8/12/2023 10/1/2023 11/20/2023 1/9/2024 2/28/2024 Date - M/D/Y
Step by Step Solution
There are 3 Steps involved in it
1 Expert Approved Answer
Step: 1 Unlock

Question Has Been Solved by an Expert!
Get step-by-step solutions from verified subject matter experts
Step: 2 Unlock
Step: 3 Unlock