

Question: Give a well supported paragraph interpreting each graph: What does that graph represent? What does the shape of the graph tell you about how the
- Give a well supported paragraph interpreting each graph: What does that graph represent? What does the shape of the graph tell you about how the data have changed over time?
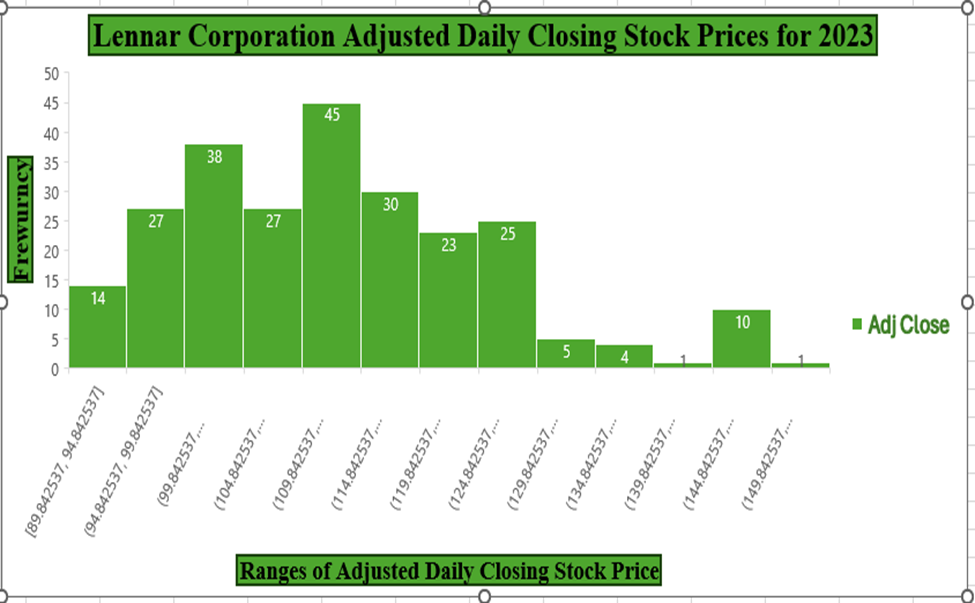
Lennar Corporation Adjusted Daily Closing Stock Prices for 2023 50 45 45 40 35 38 30 Frewurncy 27 27 25 23 14 10 "Adj Close 5 [89.842537, 94.842537] (94.842537, 99.842537] (99.842537,... (104.842537,... (109.842537,... (114.842537,... (119.842537,... (124.842537,... (129.842537,... (134.842537,... (139.842537,... (144.842537,... (149.842537,... Ranges of Adjusted Daily Closing Stock Price\f
Step by Step Solution
There are 3 Steps involved in it
1 Expert Approved Answer
Step: 1 Unlock

Question Has Been Solved by an Expert!
Get step-by-step solutions from verified subject matter experts
Step: 2 Unlock
Step: 3 Unlock