

Question: give the code by using octave this is the final simulation z = new plot(t0) t=1 :0.01:5; Y(t)=.......... y=3*.........t.*cos(pi*t.^2); new_y = z = (mean y_new_y);
give the code by using octave
this is the final simulation
z = new plot(t0)
t=1 :0.01:5;
Y(t)=..........
y=3*.........t.*cos(pi*t.^2);
new_y =
z = (mean y_new_y);
this is the draft of the program, can give me a full and correct version??
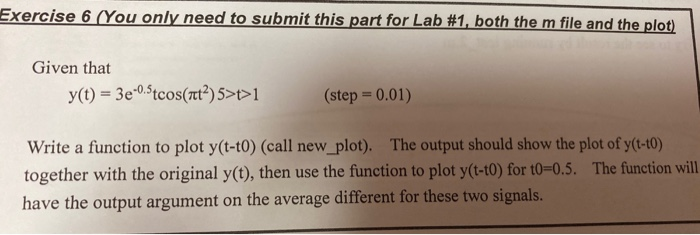
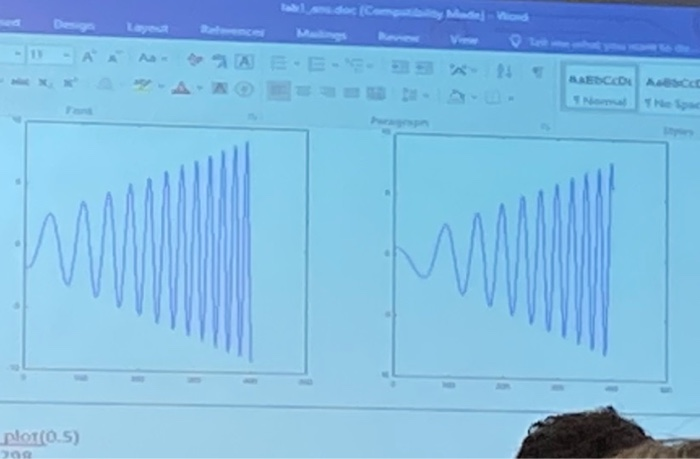
Exercise 6 (You only need to submit this part for Lab #1, both the m file and the plot) Given that y(t) = 3e-0.5tcos(rut?)5>1>1 (step = 0.01) Write a function to plot y(t-to) (call new_plot). The output should show the plot of y(t-10) together with the original y(t), then use the function to plot y(t-to) for t0=0.5. The function will have the output argument on the average different for these two signals. doc ( C M Vand REDCASCO plot(0.5)
Step by Step Solution
There are 3 Steps involved in it
1 Expert Approved Answer
Step: 1 Unlock

Question Has Been Solved by an Expert!
Get step-by-step solutions from verified subject matter experts
Step: 2 Unlock
Step: 3 Unlock